요약남중국해는 심해 분지, 대륙 붕단, 얕은 대륙붕, 많은 해협, 복잡한 수심 특징을 가진 전형적인 연안 영해이다. 본 연구에서는, 비구조 격자 기반으로 대상 해역을 상세하게 해상할 수 있으며, 개방경계에 조석을, 해표면에 기상자료를 입력하여 조석 및 폭풍해일을 모의할 수 있는 수치 모델을 구축하여 남중국해의 조석 특성과 전파 양상을 조사하고, 태풍에 의한 폭풍해일을 재현하였다. 태풍에 의한 폭풍해일 모의는, 2013년에 필리핀에 막대한 피해를 초래하였던 태풍 하이옌에 대해서 수행하였다. 관측치 및 선행 연구의 조석 분포와의 비교 결과, 4개의 주요 분조의 진폭과 위상은 대체적으로 잘 모의되었다. 선행 연구들에 따르면, 당 해역은 모델을 이용하여 조석을 예측하기가 어렵다고 보고되고 있는데, 이 점을 감안한다면 본 연구에서 예측한 조석은 허용 범위에 있다고 생각된다. 본 연구에서 수행한 자유 진동 모드 실험을 통해서 남중국해가 일주조 조석이 우세한 이유를 알 수 있었으며, 조석 잔차류(tidal residual current) 및 총에너지 소실(total energy dissipation) 산정을 통해서 조석 및 퇴적환경을 파악하였다. 본 연구에서 구축한 모델을 이용하여 태풍 하이옌에 의한 폭풍해일을 타당하게 모의하였으며, 모델 검증 및 조석 환경 규명을 통하여 남중국해의 지역 실시간 순압 조석/수위 예측 시스템을 구축하였다.
AbstractThe South China Sea (SCS) is a typical marginal sea characterized with the deep basin, shelf break, shallow shelf, many straits, and complex bathymetry. This study investigated the tidal characteristics and propagation, and reproduced typhoon-induced storm surge in this region using the regional real-time tide-surge model, which was based on the unstructured grid, resolving in detail the region of interest and forced by tide at the open boundary and by wind and air pressure at the surface. Typhoon Haiyan, which occurred in 2013 and caused great damage in the Philippines, was chosen as a case study to simulate typhoon's impact. Amplitudes and phases of four major constituents were reproduced reasonably in general, and the tidal distributions of four constituents were similar to the previous studies. The modelled tide seemed to be within the acceptable levels, considering it was difficult to reproduce the tide in this region based on the previous studies. The free oscillation experiment results described well the feature of tide that the diurnal tide is prevailing in the SCS. The tidal residual current and total energy dissipation were discussed to understand the tidal and sedimentary environments. The storm-surge caused by typhoon Haiyan was reasonably simulated using this modeling system. This study established the regional real-time barotropic tide/water level prediction system for the South China Sea including the seas around the Philippines through the validation of the model and the understanding of tidal characteristics.
1. IntroductionThe South China Sea (SCS) is a typical marginal sea characterized with the deep basin, shelf break, and shallow shelf. The SCS has the complex topography such as many straits and complex bathymetry. The SCS also consists of a deep basin with two continental shelves (approximately 55% of the total size) along the north and southwest coasts. In the northern SCS, the SCS connects to the East China Sea through the Taiwan Strait, and to the Pacific Ocean through the Luzon Strait. In the southern part of the basin, it links with the Java Sea through the Karimata Strait, and with the Sulu Sea through several narrow channels between the Philippines Islands (Fig. 1). The water depth exceeds 5000 m in the deep basin, whereas shelves show the shallow water depth less than 100~200 m.
Since engineer Davenport of the East Indies reported the once-daily tide in the Gulf of Tonkin with observation at Doson to Royal Society in 1687, Cartwright (2003) summarized again the subsequent history of prediction practice on the tide of the Gulf of Tonkin. Fig. 2 shows the calculated tidal elevation in September 2000 at Hon Dau Island. The synthesized tidal elevation by Cartwright (2003) was compared with the predictions using the tidal observation data by University of Hawaiian Sea Level Center (UHSLC) and the NAOTIDE tidal database (Matsumoto et al., 2000).
The tidal characteristics of these regions were reported in many studies. For very complex tidal behavior in these regions, the tides based on the observation show the similar tidal ranges but the tide based on the numerical model is not accurate even assimilation was forced. The hydrodynamic modelling of the area turned out to be very difficult and results produced so far by different investigators do not always match (Akdag, 1996). Wyrtki (1961) analyzed the data to produce co-tidal charts on four major tidal constituents and the figure of the classification of tides. However, the co-tidal charts shown before the 1980s are not elaborate over the shelf areas. The tides in the South China Sea and the Java Sea area have been previously modelled with different region of interests with varying degree of reproduction (Akdag, 1996; Azmy et al., 1990; Roos, 1989; Thuy, 1968; Ye and Robinson, 1983).
According to Fang et al. (1999), the tidal currents are very weak in the deep basin, while the tidal regime, especially the semi-diurnal tides are complex and the tidal currents may be strong in the shelf. In addition, the complex and steep bottom topography of the SCS has a great influence on the wind-induced circulation and the distribution, propagation and dissipation of the tidal energy (Egbert and Ray, 2000). Egbert and Ray (2000) suggested that the higher frequency forcing from the tide should not be neglected in the circulation, mass and energy transport and ecosystem dynamics in the ocean and tidal current is a significant energy sources for mixing. A model by DHL (Roos, 1989) was focused on coastal zone of the Java Sea with nested grids over the similar model boundary to our present model but northern boundary was limited to middle part of the South China Sea. The tidal regime of the Gulf of Tonkin was focused on the diurnal tidal pattern with larger amplitude in the north at the head of the gulf (Thuy, 1968; Manh and Yanagi, 2000; Minh et al., 2014). Diurnal tidal regimes are commonly microtidal, but the Gulf of Tonkin is one of the few basins with a mesotidal, and locally even macro tidal diurnal regimes (van Maren et al., 2004). Minh et al. (2014) studied the dominant physical processes that characterize tidal dynamics in the Gulf of Tonkin using a high-resolution model. Particular attention is thus given to modeldata cross-examination using tidal gauges and coastal satellite altimetry and to model calibration derived from a set of sensitivity experiments to model parameters. Cai et al. (2006) used a three-dimensional baroclinic model to evaluate the precision of the predicted tidal harmonic constants in the South China Sea (SCS) under variable different conditions; model dimensions, open boundary conditions considering the mean sea surface height, astronomical tidal forcing, the baroclinic effect by stratifications and wind forcing. The three-dimensional model with astronomical tidal forcing and mean sea surface height at the open boundary predicted more accuracy results on tidal harmonic constants.
The aim of this study is to understand the tidal characteristics and propagation for the South Asian Seas covering the South China Sea (SCS) including the Java Sea, adjacent marginal seas and the Philippines Sea using the highresolution tide-surge model forced by the equilibrium tide and co-oscillating tide at the straits. The tide-surge simulation was conducted to hindcast storm surges on the super typhoon Haiyan (Yolanda) on November, 2013 using this model. Results delivering tidal characteristics and propagation and the performance to predict tide-surge in the SCS are presented and discussed. Also, some of strategies to make the real-time barotropic forecast not only over the wide sea area but also the specific region are discussed based on focusing on the specific region in very detailed fine mesh system.
2. Numerical SimulationA modeling technique that converts the model equations to a discrete form and allows the computation over spatially unstructured meshes has been used as a main component of a regional ocean tide simulator that takes advantage of more accurate representations of the coastlines, manmade dikes, coastal structures, and topographic features. Rather than refining the dynamic grid nesting technique to retain the finite difference scheme, we decided instead to adopt a finite element technique that permits more flexibility when fitting regular coastlines and allows bathymetry with elements of an arbitrary size, shape and orientation. The model coverage is considerably large including semienclosed sea areas and Philippian Islands from 100° to 142° east longitude and from 7° south latitude to 25° north latitude. The horizontal mesh system was constructed using the conforming Delaunay triangulation (CDT) method and the depths in each node points are interpolated from the GEBCO 30" bathymetry dataset. The resolution of GEBCO dataset is coarse to describe the complex shape of topography near the coastline, so it may cause some error in the numerical simulation. More detailed depth data are necessary for higher precision calculations. Approximate mesh sizes in the region of interest were formulated as a few tens of meters and the bathymetry of the tidal flat area was described, thus enabling a detailed representation of tidal characteristics in the tidal regime. Relatively high-resolution numerical model grid is adopted in this study comparing with previous studies, for example the model grid size of Zu et al. (2008) is about 10 km, and that of Fang et al. (1999) is approximately 27 km. Fig. 1 shows the overall meshes of the model domain and the detailed meshes for Leyte Gulf and neighboring seas of Tacloban City, Philippines. The total meshes consist of 197,934 vertices and 387,476 triangular elements.
For the calculation of the tide in the fine finite element system, SELFE (A Semi-implicit Eulerian-Lagrangian Finite-Element) model, based on unstructured grids, designed for the effective simulation of 3D baroclinic circulation across river-to-ocean scales, has been used. It uses a semi-implicit finite-element Eulerian-Lagrangian algorithm to solve the Navies-Stokes equations written to realistically address a wide range of physical processes and of atmospheric, ocean and river forcings. The numerical algorithm is high-order, and stable and computationally efficient. SELFE solves the 3D shallow-water equations, with hydrostatic and Boussinesq approximations, and transport equations for salt and heat. The primary variables that SELFE solves are free-surface elevation, 3D velocity, 3D salinity, and 3D temperature of the water. Details for physical formulation are described in Zhang and Baptista (1999) and Zhang et al. (2004).
Semi-implicit schemes are applied to all equations; the continuity and momentum equations are solved simultaneously, thus bypassing the most severe stability restrictions (e.g. CFL). A key step in SELFE is to decouple the continuity and momentum equations via the bottom boundary layer. SELFE uses an Eulerian-Lagrangian method (ELM) to treat the advection in the momentum equation, thus further relaxing the numerical stability constraints. The advection terms in the transport equations are treated with either ELM or a finite-volume upwind method (FVUM), the latter being mass conservative. In SELFE, unstructured triangular grids are used in the horizontal direction, while hybrid vertical coordinates, partly terrain-following S coordinates and partly Z coordinates, are used in the vertical direction. The one layer was used in vertical coordinate for the two-dimensional tide computation in this study. The water elevation determined from the estimation of the Japanese NAOTIDE (National Astronomical Observatory) database (Matsumoto et al., 2000) was imposed at the tidal open boundary. NAOTIDE is a program to predict ocean tidal height at given time and location using ocean tide model developed by assimilating TOPEX/Poseidon altimeter data. The short-period tide value is from 16 major constituents and 33 minor constituents which are inferred from major ones by interpolating or extrapolating the admittance. The long-period tide value is from 7 major constituents and 5 nodal modulations. 18.6-year period equilibrium tide is added to the 12 terms. Totally 62 tidal constituents are considered in this estimation of water elevation at the open boundary. Then, the realtime ocean tide simulation for the SCS was performed with the time step of 300 seconds. The run length was 40 days starting from January 1st, 2009 and the initial part of 10 days was discarded. The harmonic analysis on every node was performed during 30 days to compute eight tidal constituents; M2, S2, K1, O1, N2, K2, P1 and Q1. An additional experiment using Platzman resonant iteration scheme was conducted to investigate the free oscillation modes in the SCS.
For the storm surge simulation, the pressure and wind information during the passage of the typhoon is the most important data. Typhoon wind and pressure fields for model input are blended the Holland (1980) typhoon model with the ambient wind and pressure fields. The ambient fields are computed by the NCEP data (http://rda.ucar.edu/datasets/ds083.2/) removing the Rankin vortex storm (Davis and Low-Nam, 2001). In general, the meteorological data of NCEP is not appropriate for the hindcast of the typhoon wind and pressure unless correct the strength typhoon using downscale model in the finer mesh system and bogus scheme.
3. Model ValidationTidal elevation amplitude and phase were calculated by the harmonic decomposition from the elevation results for the last 30 days in the simulation. The model validation was carried out by comparing the amplitude and phase at 118 tide stations which were used in the previous study (Fang et al., 1999) and UHSLC. The locations of these stations are shown in Fig. 1. Fang et al. (1999) said that the tide data were obtained from several sources, thus the quality of these data varies significantly. For instance, the harmonic constants at some stations were obtained from the measurements for only 1 or 2 days. The comparison was performed using the Root Mean Square Error (RMSE) for 4 tidal constituents and the stations of outliers are excluded. The outliers are determined by that the absolute value of the rate between the distance with the mean and the standard deviation over 2. Totally 94 data were compared with simulations. Fig. 3 presents the comparison charts for the amplitude and phase of 4 major constituents. The RMSE (Root Mean Square Error) of 4 tidal constituents excluding outliers are as follows: M2 amplitude: 21.0 cm, M2 phase: 25.9 degree, S2 amplitude: 8.23 cm, S2 phase: 29.4 degree, K1 amplitude: 9.5 cm, K1 phase: 20.1 degree, and O1 amplitude: 10.8 cm, O1 phase: 16.0 degree. The differences are attributed to disagreement between the observation stations and calculation grid points, irrelevant bottom friction coefficients, and the effect of shallow water depths.
4. Results and Discussion4.1 Tide Prediction System
Fig. 4 shows the reproduced tidal distributions of major constituents, M2, S2, K1 and O1 with minor constituents, N2, K2, P1 and Q1. The small figure in this figure indicates the enlarged image of tides in Tacloban City. The tidal distributions of four major constituents are similar to the previous studies (Cai et al., 2006; Fang et al., 1999; Zu et al., 2008). The largest M2 tide amplitude is found in the Taiwan Strait and the large ones are found in the south of Guangdong around Leizhou Peninsula, the northwest coast of Kalimantan, south of the Indo-China Peninsula, and around the western and southern parts of the Malay Peninsula. The amphidromic points are shown in the shelves including Gulf of Thailand. The S2 tidal chart is similar to M2 tidal chart. The highest amplitudes of S2 tide are shown near the positions displaying the highest M2 amplitude. In the case of S2 tide, the high values are also found in the southeast coast of Kalimantan and Celebes Sea. The K1 and O1 tidal charts show the amphidromic points in Gulf of Thailand and the K1 and O1 tidal amplitudes are larger than S2 tide. The phase directions of semi-diurnal tides are shown in clockwise propagation and the phase directions of diurnal tides are shown in counterclockwise propagation at the Gulf of Thailand. Yanagi and Toshiyuki (1998a) reported the mechanism of clockwise phase propagation of semidiurnal tide and counterclockwise phase propagation of diurnal tide at the central part of the Gulf of Thailand.
The tidal amplitudes of semidiurnal tide M2 and S2 are high in the east of Leizhou Peninsula, while those of K1 and O1 tides are high in the west of Leizhou Peninsula. Fang et al. (1999) reported that the amplification of semi-diurnal tides in the shelf sea east of the Leizhou Peninsula is much greater that diurnal tides. This pattern was described by Cao and Fang (1990) by means of the theory of Clarke and Battisti (1981). Both K1 and O1 tidal charts show the degenerate amphidromic system centered at the middle of Vietnam coast. This feature is also depicted in Fang et al. (1999). The tidal charts of four minor constituents were also obtained from the simulation. The amphidromic points of N2 and K2 constituents are shown near the positions of M2 and S2 constituents. In addition, the spatial distribution of high or low amplitude is similar to those of M2 and S2 constituents. Maximum tidal amplitude (> 30 cm) of N2 constituent is calculated in the north-west coast of Kalimantan, and maximum one (> 10 cm) of K2 are found in the same coast. The spatial patterns of P1 and Q1 showing the amphidromic system and co-tidal line are similar to K1 and O1 tides. Generally, the tidal amplitudes of P1 and Q1 constituents are less than 30 cm and 20 cm, respectively.
4.2 Free OscillationWe computed the tidal form factor to indentify the tidal regime of SCS because interestingly there are the distinctive tide distribution depending on tidal constituents and regions (Fig. 4). The tidal form factor, F is calculated as F = (AK1 + AO1)/(AM2 + AS2), where Aconstituent is the tidal amplitude of each constituent. If F < 0.25, tides are semi-diurnal. In the cases that F ranges from 0.25 to 1.50 or from 1.50 to 3.0, tides are dominantly semi-diurnal or dominantly diurnal, respectively. If F > 3, there is diurnal tides. Fig. 5 depicts the tidal regimes in the SCS, classified by tidal form factor, F, which was computed from modeled tidal amplitudes (Fig. 4). Overall, this distribution is similar to the figure of van Maren and Gerritsen (2012) computed with the TPX06 ocean tide model. The difference of types between our study and van Maren and Gerritsen (2012) is shown the west of Luzon Island, Sulu Sea, Celebes Sea, Java Sea and the east of Philippine Islands, however its difference is just one grade and the type like semi-diurnal or diurnal tides is approximately equal each other. Comparing Fig. 5 with cotidal charts (Fig. 4), the regions characterized by semi-diurnal tide are the Taiwan Strait, the east of Leizou Peninsula, the south-east of Indo-China Peninsula, the north-west of Kalimantan Island, Celebes Sea and Philippine Sea, especially the strong semi-diurnal tide in the Taiwan Strait. On the other hand, the regions classed as diurnal tide are the overall SCS excluding the regions with semi-diurnal tide, and in particular, the very predominant diurnal tide are shown in the Gulf of Tonkin, the west of Luzon Island, Gulf of Thailand, Karimata Strait and a part of the Java Sea.
We had the experiment to reveal the free oscillation modes in the SCS using Platzman resonant iteration scheme. This experiment was also performed in the previous studies (Choi and Yuk, 2003) and the results determined the characteristics of tide in the Yellow Sea and the free oscillation mode change due to the tidal barrier and the near-resonant characteristics of the Ariake Sea.
The numerical model was run for approximately 30 days from the initial state of the motion with the fixed elevation of 0 m in the open boundary and the initial elevation of a certain value, i.e., 2 m in all nodes inside. The simulated water elevations were used to compute the free oscillation mode. The power spectrum using the water elevation results of the free oscillation experiment was calculated at ten points as follows (Fig. 5): P1 inside the Gulf of Tonkin, P6 at Leizhou outside the Gulf of Tonkin, P2 and P5 inside SCS, P3 and P4 inside the Gulf of Thailand, P9 and P10 inside Java Sea, P8 inside Celebes Sea and P9 inside Sulu Sea. These 10 points correspond to the representative of regions classified by tidal form factor (center of Fig. 5). Here, water elevations were stored in at intervals of 10 minutes and the ones recorded for the early two days were discarded for the computation of free oscillation mode.
Frequency spectra were calculated at points sampled at 0.5 degree resolution in the SCS using Fast Fourier transform (FFT). Also Blackman-Turkey method, which was applied to the Yellow Sea and the Ariake Sea in the previous studies (Choi, 1980; Yuk et al., 2011), was used for the comparison with FFT results. The FFT results show that generally the SCS has free oscillation with the period of around 20 hours except the Gulf of Tonkin, the Gulf of Thailand and the Java Sea and thus is close to the periods of diurnal tide (P2 and P5 in Fig. 5). The Gulf of Tonkin (P1 in Fig. 5) has the periods of around 10 hours, 20 hours and 31 hours. The periods of around 57 hours are shown in the center of Gulf of Thailand (P4 in Fig. 5) and the periods of around 49 hours are shown in the Java Sea (P9 in Fig. 5). Blackman-Turkey method’s frequency spectra distribution were different from FFT’s results, however the peak periods were quite similar to FFT’s ones on the whole region.
Zu et al. (2008) showed that the amplitude of M2 tide decreases in the SCS basin after propagating from the Pacific Ocean through the Luzon Strait, while that of K1 tide increase remarkably. According to Zu et al. (2008), the K1 tide is amplified by the Helmholtz resonance inside the SCS, considering that the phase and amplitude of the K1 tide are nearly constant, and based on the resonant frequency for a Helmholtz oscillator and basin shape information (area and length) of the SCS and Luzon Strait, the resonant period of the basin is calculated as 24.8 hours, which is close to the diurnal tidal periods of K1 (23.93 h) and O1 (25.82 h). The co-amplitude and co-phase patterns of the S2 and O1 tides are similar to the M2 and K1 tides, respectively. The amplitude of the S2 tide is much smaller than that of M2 tide, whereas the amplitude of O1 tide is comparable to that of K1 tide. O1 tide also responds to Helmholtz resonance in the SCS basin. Our study shows that the prevailing peak periods are approximately 20 hours in the SCS, which is comparable to Zu et al. (2008).
It is well known that the amplitude of semi-diurnal tide, M2, is quite large in the Taiwan Strait in many studies (Cai et al., 2006; Fang et al., 1999; van Maren and Gerritsen, 2012; Zu et al., 2008) as well as our study (Fig. 4 and 5), thus the computed free oscillation period of 10 hours demonstrates the near-resonant characteristics of this area which responds to semi-diurnal tidal period.
In the Gulf of Tonkin, Minh et al. (2014) suggested that the resonant period of 30 hours for mode 0 (Helmholtz), given that L (length of the Gulf of Tonkin) = 500 km and h (water depth) = 60 m at the entrance of the Gulf of Tonkin assuming that its basin has a rectangular type horizontally and non-uniform depth with a constant slope vertically (Rabinovich, 2009). If considering the Coriolis force, the period becomes smaller, i.e., 29 hours. In addition, Minh et al. (2014) estimated the resonant modes of this basin using the numerical simulation that the single tidal force of O1 constituent was imposed, the forcing period varied from 4 to 56 hours and the model run length was 360 hours. The model result showed the resonant peak was seen around a period of approximately 29 hours. This period was very close to the other period, i.e., 29 hours obtained assuming the basin has a rectangular type and the constant slope and the effect of earth rotation. Our study exhibits the free oscillation period of about 30 hours in the Gulf of Tonkin, which is nearly the same as the result of Minh et al. (2014).
Therefore, through the comparison with the earlier studies (Fang et al., 1999; Minh et al., 2014; Zu et al., 2008), our study is able to estimate free oscillation mode accurately, and thus explain reliably the near-resonant characteristics and tidal regime of the basin determined by it.
4.3 Residual TransportWe calculated the residual currents by averaging the tidal currents over the fortnightly tidal cycle. Here the modeled tidal currents were obtained from the ones for the last 15 days among the tidal simulation results with the run length of 1 month, which used the water elevation determined from the 62 tidal constituents (NAOTIDE) as a tidal forcing in the open boundary. The tidal residual currents imply tidal circulation and influence the deposition of fine sands, distribution of various pollutant materials and planktons movement associated with tidal currents. In general, the tidal residual currents are small with the range of 0~5 cm/s inside the SCS, whereas those are relatively large outside the SCS, i.e., the eastern side of the Philippine Islands (Fig. 6). The tidal eddies are shown in the eastern side (near 113°E 13°N) of the Indo-China Peninsula; the inside and mouth of Gulf of Thailand; the north, northwest and southwest (Java Sea) of Kalimantan Island; and Sulu Sea. Fig. 6 also shows zooms of tidal residual current for the Gulfs of Tonkin and Thailand. Minh et al. (2014) shows the residual currents from the eight tidal constituents using the Eulerian and Lagrangian residual currents definitions in the Gulf of Tonkin. The Eulerian residual currents calculation is the same as our calculation, thus we compared our results with Minh et al. (2014), even though the used tidal constituents were different for the tidal forcing. Minh et al. (2014) presented that the residual flow was the strongest in the Hainan Strait (~20 cm/s), and approximately 6~8 cm/s near the southwestern and western Hainan Island. Our result shows the strong residual current in the nearly same places as Minh et al. (2014), but the values are smaller than them. The count-clockwise large gyre is shown parallel to the eastern coast of the Indo-China Peninsula. The difference between our result and Minh et al. (2014) may come from the differences of tidal forcings, the bottom friction and model resolution. In the Gulf of Thailand, the residual current ranges from 0 to 5 cm/s. The count-clockwise eddies are shown in the entrance (near 106°E 6°N) and inside (near 101°E 12°N and 100.5°E 10°N) of the Gulf of Thailand, while many clockwise eddies are shown along or near the coastline of the gulf. Yanagi and Takao (1998b) presents the magnitude of residual current is about 5 cm/s, and our result is similar to that. In addition, the dominant clockwise residual circulation in the Gulf of Thailand was also addressed by that study averaging tidal currents of 4 major constituents, M2, S2, K1 and O1 (Yanagi and Takao, 1998b).
Here we introduced the tidal energy dissipation as an index of assessment of tidal and sedimentary environments. We computed the tidal energy dissipation using the simulated tidal current of individual major tidal constituent, M2, S2, K1 and O1 (Fig. 7). The tidal energy dissipation is estimated by converting the maximum bottom shear stress caused by the bottom friction into work per unit area. Comparing with tidal charts of semi-diurnal and diurnal tides (Fig. 4), the distributions of M2 and S2, and K1 and O1 are similar. The maximum tidal energy dissipation (> 104 N/m) due to M2 tide is shown in the Taiwan and Malacca Straits, small channels connecting Sulu and Celebes Seas, and northwestern Kalimantan Island. The large tidal energy dissipation of about 0.5 N/m is seen in the southeastern Indo-China Peninsula. The pattern of tidal energy dissipation of S2 constituent is similar to that of M2 tide, but the magnitude of S2 is much smaller.
The tidal energy dissipation of diurnal tides, K1 and O1 is large in small channels between Sulu and Celebes Seas, the Gulf of Tonkin, the Hainan Strait, the Gulf of Thailand, the Karimata Strait and the Java Sea. In the Gulf of Thailand, the Karimata Strait and the Java Sea, energy dissipation of O1 tide is distinctly smaller than that of K1 tide, whereas in the Gulf of Tonkin including the Hainan Strait, that of O1 tide is nearly equal or comparable to that of K1 tide.
4.4 Realtime Storm Surge Simulation for Super-Typhoon HaiyanThe typhoon Haiyan occurred on Nov. 4 and decayed on Nov. 11, 2013. The lowest pressure is 895 hPa and the maximum wind speed (1 minute average) is 87 m/s. NDRRMC (2014) said a death and missing toll of 7,400 due to the typhoon.
Fig. 8 shows the track of typhoon Haiyan and the radius of maximum wind during November 5th to 11th, 2013. The central location of typhoon and minimum pressure obtained from Digital Typhoon (http://rda.ucar.edu/datasets/ds083.2/) and the radius of maximum wind is estimated by Rankin equation using the radiuses of storm and gale winds (Kim, 2015). We strengthened typhoon wind and pressure for the model input by blending the Holland typhoon model with the ambient wind and pressure fields. Here the ambient fields are obtained from NCEP removing the Rankin vortex storm (Davis and Low-Nam, 2001). The central pressure of NCEP is approximately 100 hPa higher (week intensity) than JMA data when the typhoon passed Tacloban. Fig. 9 shows the wind and pressure fields of NCEP data, typhoon removed, Holland model and blending.
Fig. 10 shows the comparison of water elevations observed and simulated at five stations during the typhoon Haiyan. The observed water elevations are obtained from GLOSS (Global Sea Level Observing System). The significant surge is not shown in all stations because all stations are located afar beside the passage of typhoon. The semi-diurnal tides in Davao is simulated closely to the observation, but the diurnal tides do not show high accuracy with the observation.
Fig. 11 shows the observed runup height surveyed by the joint team of Japan Society of Civil Engineers and Philippine Institute of Civil Engineers (JSCE-PICE) (Tajima et al., 2014; Mori et al., 2014) and computed maximum surge height in the Leyte Bay. The high runup height caused by inundation is shown around San Pablo Bay but the numerical simulation made high surge height over 5 meter near Tacloban only. These differences come from the simulation conditions and wave setup. The total surge depends on wind surface stress, inverted barometer effects, and wave forcing, as well as tidal stage and bathymetry in the path of the storm. Weaver (2004) examined the wave forcing contributes approximately 25% to 33% of the total rise in water level generally. The simulation does not consider the inundation effect using wet-and-dry condition and cut off the bathymetry depth to 5 meter. The high surge wave can amplify depending on the size and bathymetry of the bay in local area (Mori et al., 2014). The observations within 3 km distances are drawn in the box-and-whisker error bar and compared with time series of simulated storm surge in Fig. 12. The bottom and top of box means 25% and 75% quantile with the line of median value. The minimum (0% quantile) and maximum (100% quantile) of survey data are shown in black line. Although the median runup heights are about twice than the simulated maximum surge heights, the simulated maximum surge heights are similar with the minimum survey runup heights in Tacloban, Basey and Javier.
5. ConclusionsThe first step for the construction of the regional realtime ocean tide and storm-surge prediction in the SCS was fulfilled by using the fine FEM model and verifying the model based on the comparison between the reasonably-simulated co-tidal chart for principal constituents and time-series of water level and the measurements. In addition, the model results described reasonably the tidal characteristics of the SCS in terms of free oscillation mode, tidal residual current, and total energy dissipation.
The current study essentially aims at creating the realtime barotropic tide/waterlevel forecast system via short term meteorological forecast for the SCS, and will take into account the wave setup and inundation in the future works.
감사의 글This research was parts of the project for study on air-sea interaction and process of rapidly intensifying typhoon (MOF) and the development of the technical supporting system for marine radioactive release accidents (KIOST).
Fig. 1.Overall meshes of the model domain and the detailed meshes near Tacloban City, the Philippines with the water depth. Also tide stations referred to Fang et al. (1999), University of Hawaii Sea Level Center (UHSLC) and Global Sea Level Observing System (GLOSS) were marked for the tidal elevation comparison. 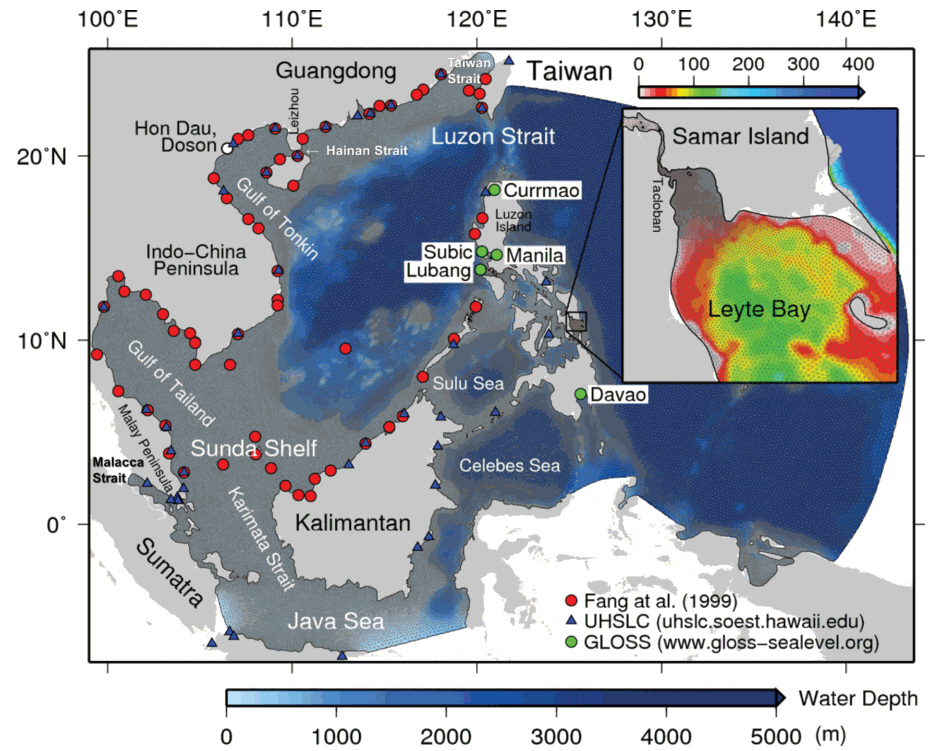
Fig. 2.The synthesized tidal elevation at Hon Dau Island by Cartwright (2003), the prediction of tidal elevation using the UHSLC tidal observation data and the tidal database (NAO99). 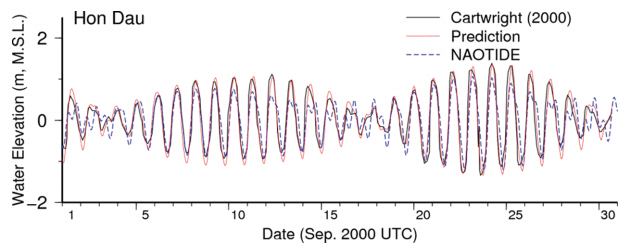
Fig. 3.Comparison of amplitude and phase of four major constituents between calculations and observations. 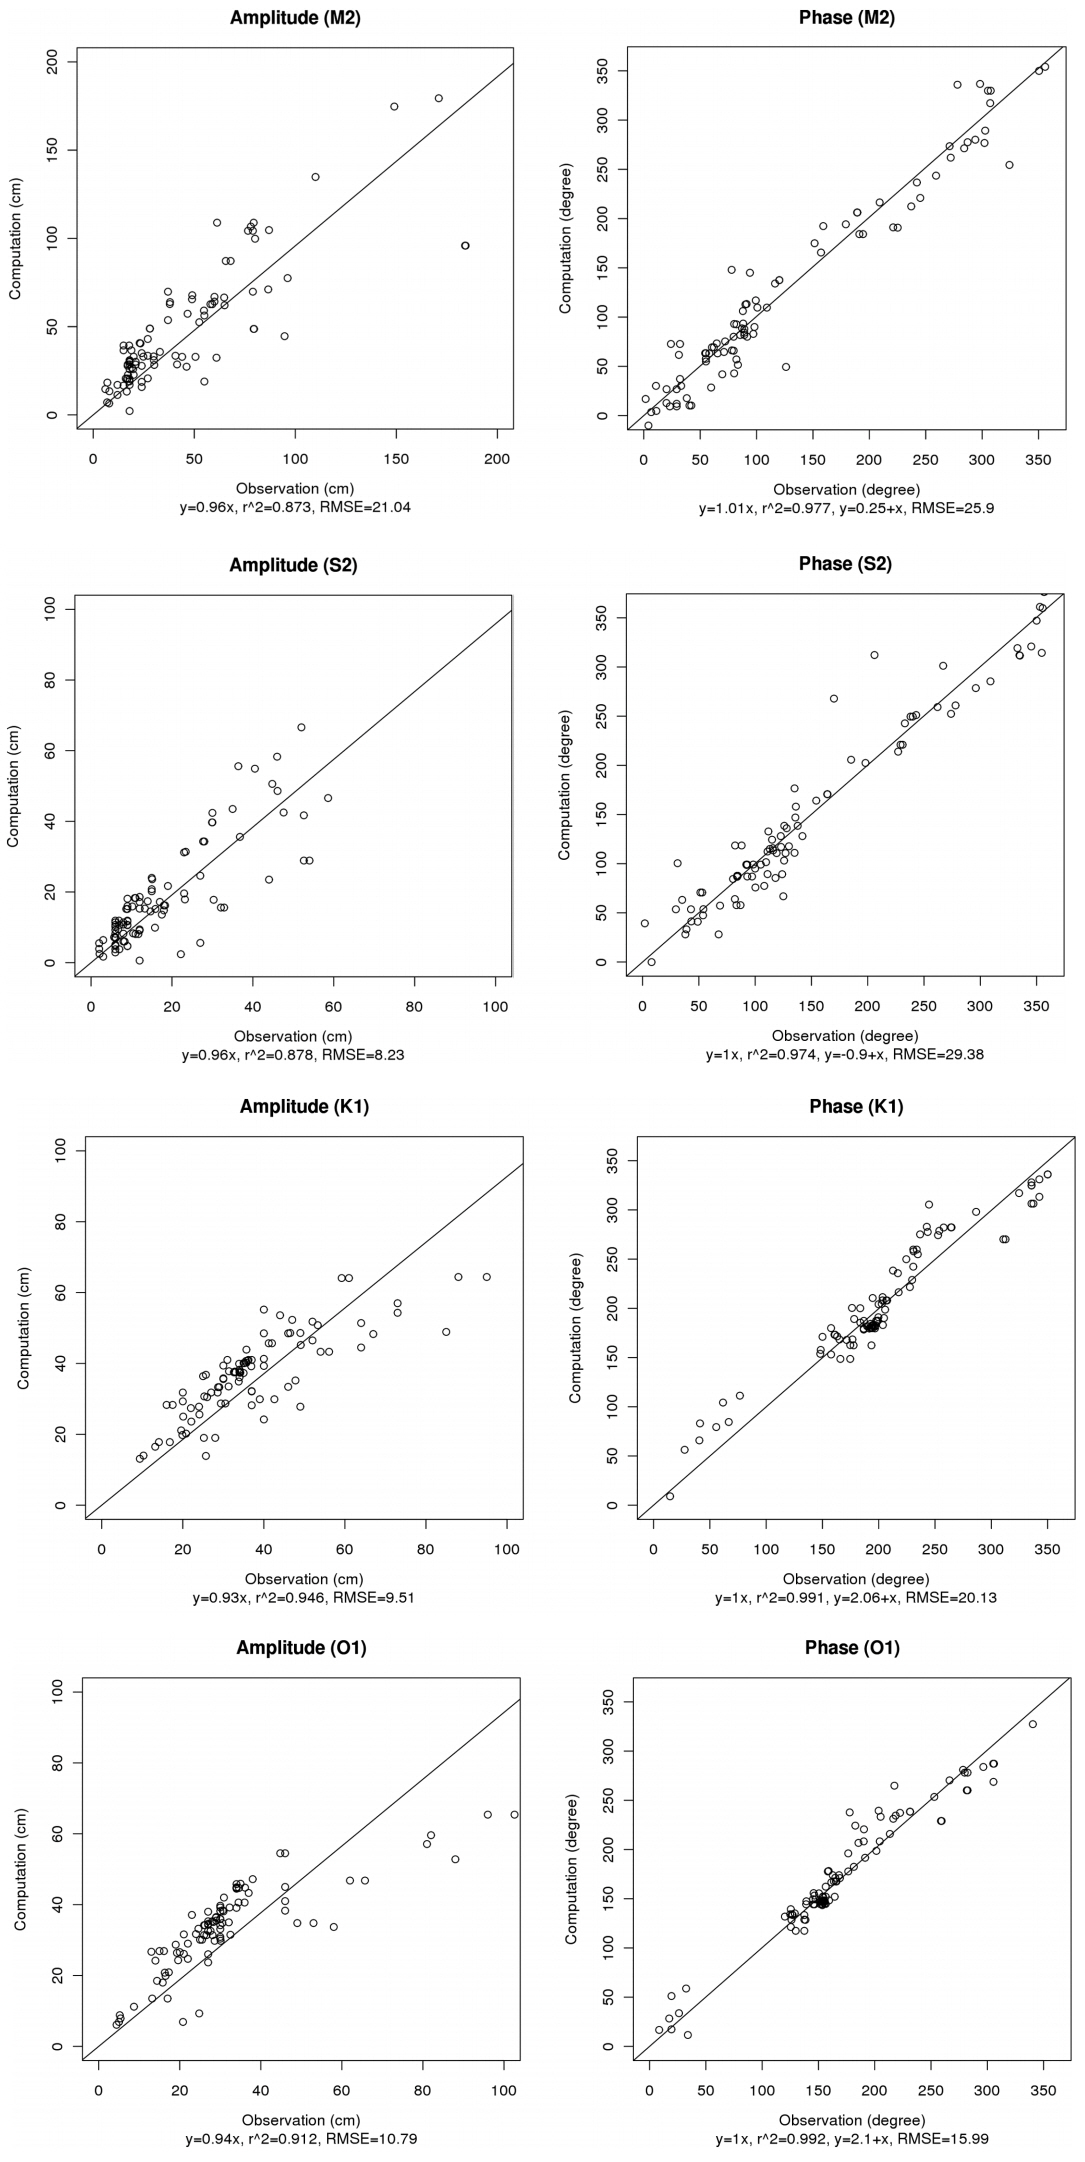
Fig. 4.Computed tidal charts on eight tidal constituents. Co-phase indicates Greenwich phase-lag (G). 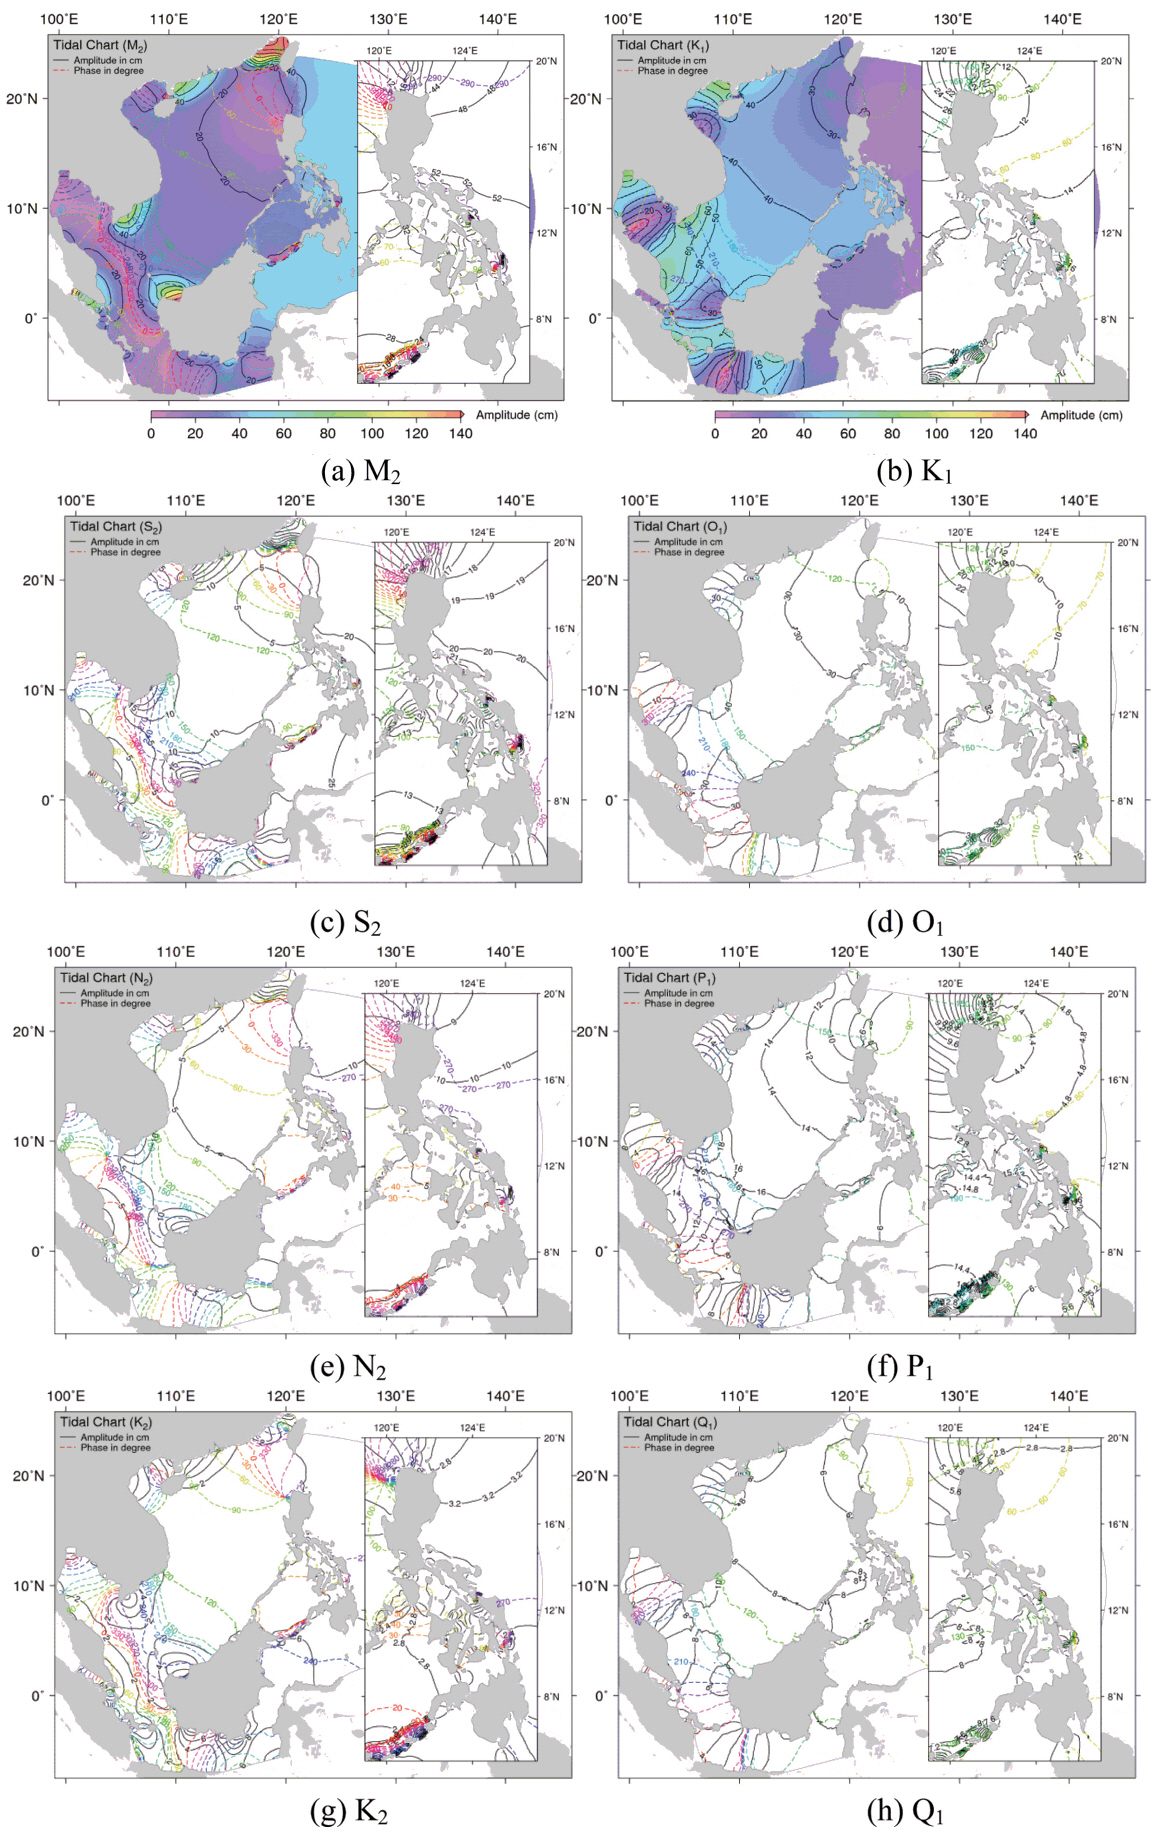
Fig. 5.The classification of tide computed by the tidal form factor and the power spectrum using the free oscillation experiment on 10 points. 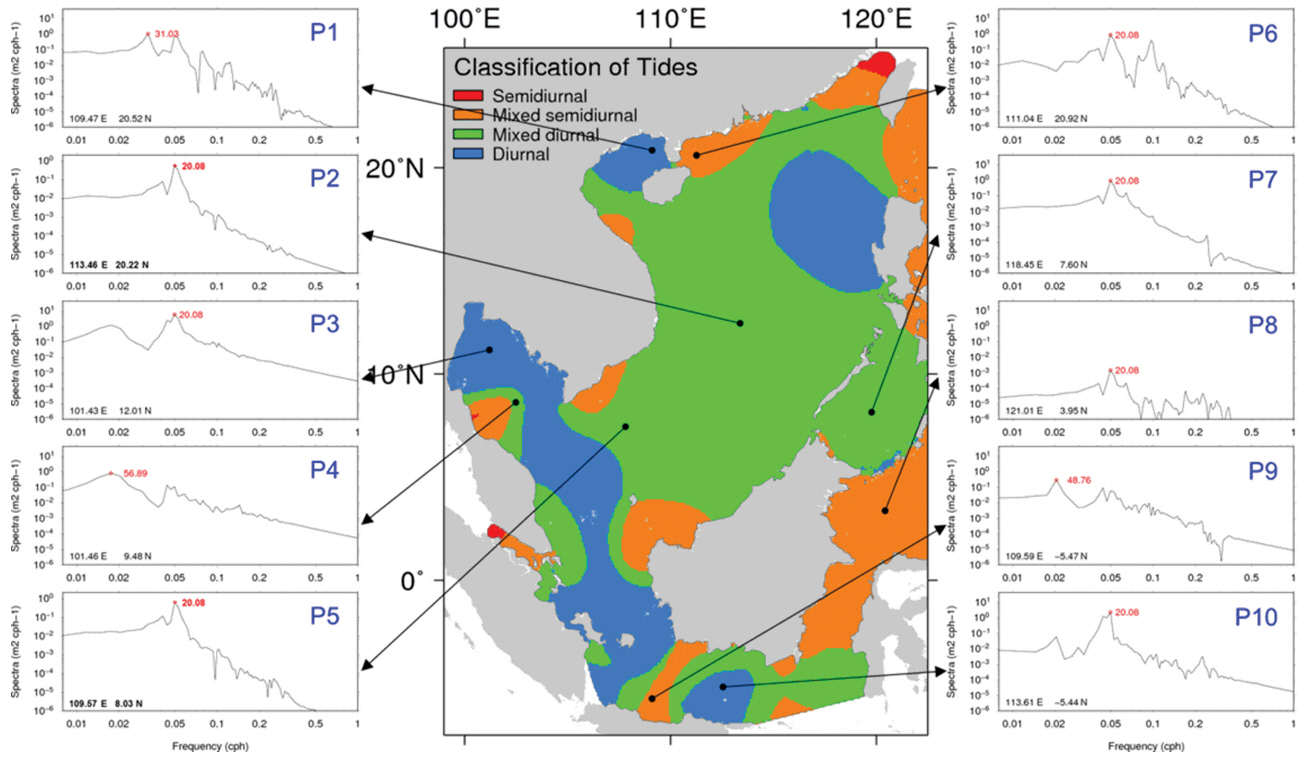
Fig. 9.The wind and pressure fields of (a) NCEP data, (b) typhoon removed, (c) Holland model and (d) blending with (b) and (c). 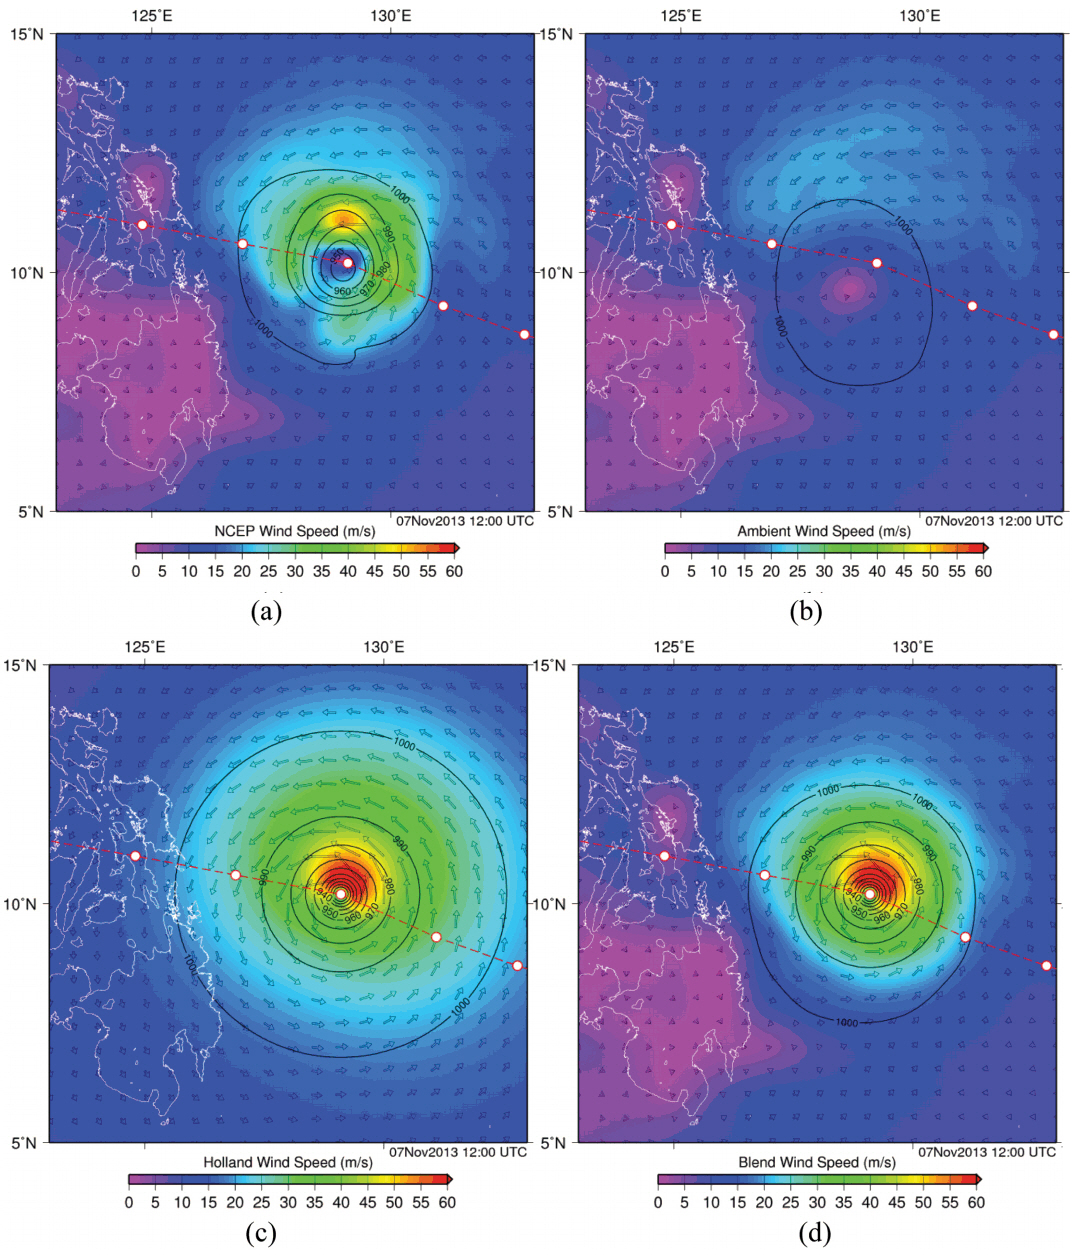
Fig. 10.Comparison of water elevations in GLOSS five stations (Currmao, Davao, Lubang, Manila and Subic). 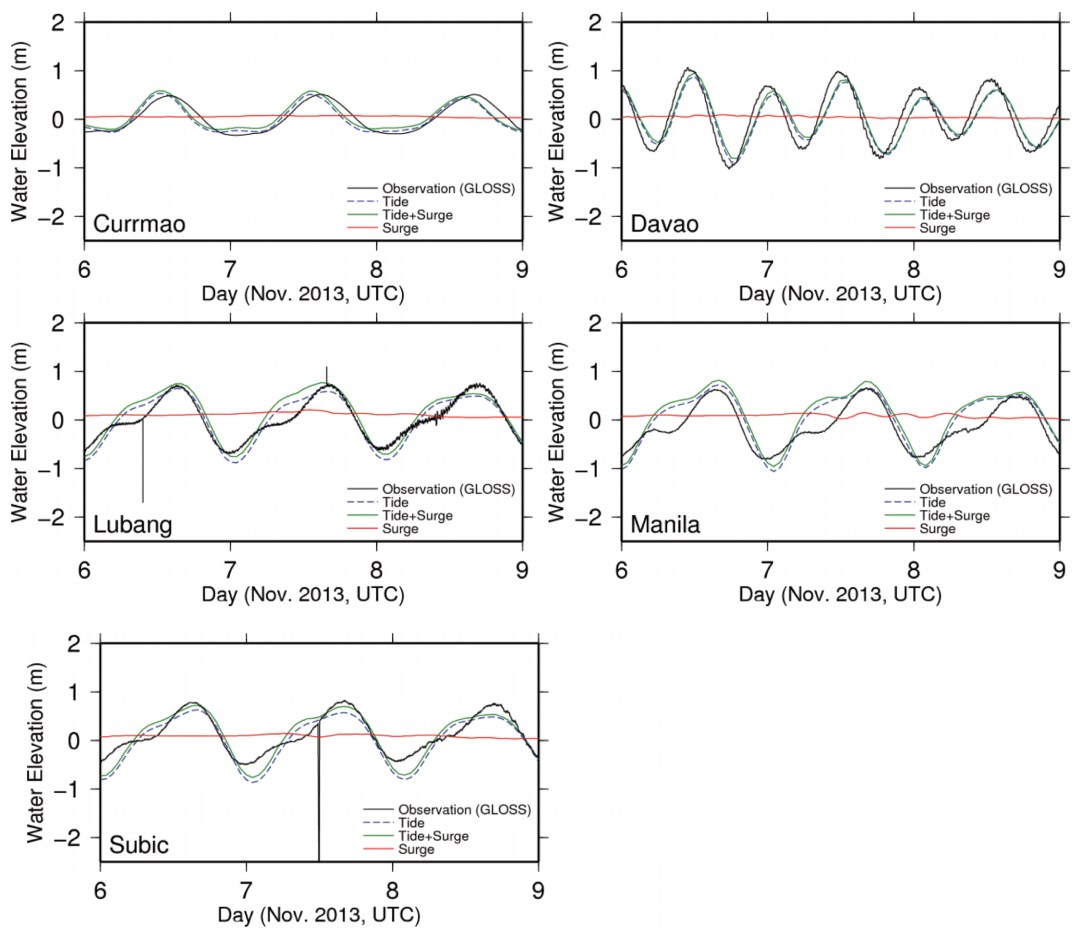
Fig. 11.The observed runup height surveyed by JSCE-PICE Typhoon Haiyan joint survey team (Tajima et al., 2014; Mori et al., 2014) and computed maximum surge height in the Leyte Bay. 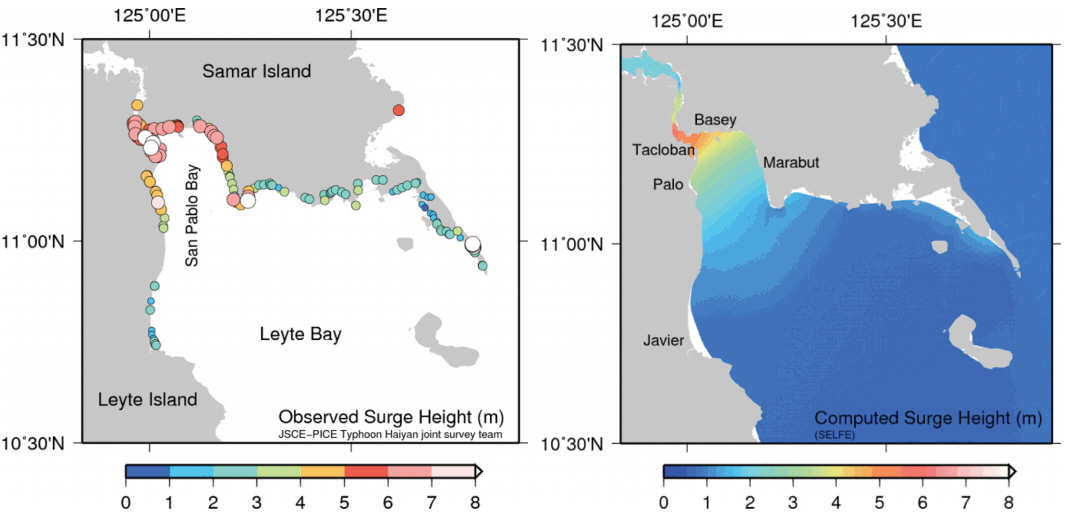
ReferencesAkdag, C. (1996). Tidal analysis of the South China Sea. Master Thesis.. Delft University of Technology..
Azmy, AR, Isoda, Y, Yanagi, T (1990). M2 tide around west Malaysia., Memoirs of the Faculty of Eng., Ehime Univ, XII(1):137-147.
Cai, S, Long, X, Liu, H, Wang, S (2006). Tide model evaluation under different conditions, Continental Shelf Research, 26, 104-112.
Cao, D, Fang, G (1990). A numerical model for tides and tidal currents in northern South China Sea, Tropic Oceanology, 9, 63-70 (in Chinese with English abstract)..
Choi, BH. (1980). A tidal model of the Yellow Sea and the Eastern China Sea., Korean Ocean Res.. Development Inst., Report, 80-02.
Choi, BH, Yuk, JH (2003). Changes in free oscillation mode in Isahaya Bay due to a barrier, Proceedings of the Korean Society of Coastal and Ocean Engineers Conference, 14, 250-269.
Clarke, AJ, Battisti, DS (1981). The effect of continental shelves on tides, Deep-Sea Research, 28, 665-682.
Davis, C, Low-Nam, S. (2001). The NCAR-AFWA tropical cyclone bogussing scheme, technical report. Air Force Weather Agency, Offutt Air Force Base, Nebr..
Egbert, GD, Ray, RD (2000). Significant dissipation of tidal energy in the deep ocean inferred from satellite altimeter data, Nature, 405, 775-778.
Fang, G, Kwok, Y-K, Yu, K, Zhu, Y (1999). Numerical simulation of principal tidal constituents in the South China Sea, Gulf of Tonkin and Gulf of Thailand, Continental Shelf Research, 19, 845-869.
Holland, GJ (1980). An analytic model of the wind and pressure profiles in hurricanes, Monthly Weather Review, 108(8):1212-1218.
Kim, KO (2015). Typhoon storm surge simulation for typhoon Haiyan, Journal of International Development and Cooperation, 21, 17-25.
Manh, DV, Yanagi, T (2000). A study on residual flow in the Gulf of Tongking., J. Oceanogr, 56, 59-68.
Matsumoto, K, Takanezawa, T, Ooe, M (2000). Ocean tide models developed by assimilating TOPEX/POSEIDON altimeter data into hydrodynamical model: a global model and a regional model around Japan, Journal of Oceanography, 56, 567-581.
Minh, NN, Patrick, M, Florent, L, Sylvain, O, Gildas, C, Damien, A, Uu, DV (2014). Tidal characteristics of the gulf of Tonkin, Continental Shelf Research, 91, 37-56.
Mori, N, Kato, M, Kim, S, Mase, H, Shibutani, Y, Takemi, T, Tsuboki, K, Yasuda, T (2014). Local amplification of storm surge by super Typhoon Haiyan in Leyte Gulf, Geophysical Research Letters, 41, 5106-5113.
NDRRMC. (2014). Final report effects of typhoon Yolanda (Haiyan). National Disaster Risk Reduction and Management Council, p 85.
Rabinovich, AB. (2009). Seiches and harbor oscillations., In: Kim YC, ed. Hand-book of Coastal and Ocean Engineering. World Scientific, Singapore: p 193-236.
Roos, A. (1989). IHE course 1989–1990, Lecture Notes on Tides..
Tajima, Y, Yasuda, T, Pacheco, BM, Cruz, EC, Kawasaki, K, Nobuoka, H, Miyamoto, M, Asano, Y, Arikawa, T, Ortigas, NM, Aquino, R, Mata, W, Valdez, J, Briones, F. (2014). Initial report of JSCE-PICE joint survey on the storm surge disaster caused by Typhoon Haiyan., Coastal Engineering Journal. 56(1):http://dx.doi.org/10.1142/..
Thuy, NN (1968). Some peculiarities of the pormation of tidal phenomena in the South China Sea, Okeanologia, 9(2):222-230.
van Maren, DS, Hoekstra, P, Hoitink, AJF (2004). Tidal flow asymmetry in the diurnal regime: Bed load transport and morphologic changes around the Red River Delta, Ocean Dynamics, 54, 424-434.
van Maren, DS, Gerritsen, H (2012). Residual flow and tidal asymmetry in the Singapore Strait, with implications for resuspension and residual transport of sediment., J Geophys Res, 117(C4):10.1029/2011JC007615.
Weaver, RJ. (2004). Effect of wave forces on storm surge. Master Thesis. University of Florida, Department of Civil and Coastal Engineering..
Wyrtki, K. (1961). Physical oceanography of the southeast Asian waters, NAGA report. Scripps Institution of Oceanography.
Yanagi, T, Takao, T (1998a). Clockwise phase propagation of semi-diurnal tides in the Gulf of Thailand, Journal of Oceanography, 54, 143-150.
Yanagi, T, Takao, T (1998b). Seasonal variation of three-dimensional circulations in the Gulf of Thailand, La Mer, 36, 43-55.
Ye, AL, Robinson, IS (1983). Tidal dynamics in the South China Sea, Geophys., J. R. Astr. Soc, 72, 691-707.
Yuk, J-H, Choi, BH, Kim, KO (2011). Changes of tides in Isahaya Bay due to a barrier, KSCE Journal of Civil Engineering, 15(3):427-437.
Zhang, Y, Baptista, AM (1999). SELFE: A semi-implicit Eulerian-Lagrangian finitie-element model for cross-scale ocean circulation, Ocean Modelling, 23, 71-96.
|
|
||||||||||||||||||||||||||||||||||