


1. Introduction
Climate change is believed to increase the number and intensity of natural disasters such as tropical cyclones, floods, heavy rains, wind waves, and storm surges, thereby exacerbating human vulnerability and damage from natural disasters. Due to the recent increase in seawater temperature, typhoons are occurring unusually late in the year, even in October in Korea. For example, Typhoon Chaba in 2016, Typhoon Kong-rey in 2018, and Typhoon Mitag in 2019 occurred in October, causing serious damage to the southern coast of Korea. Therefore, there is an increasing demand for a system that can accurately forecast tropical cyclones and resulting waves and storm surges.
Previous studies have optimized the meteorological model, the Model for Prediction Across Scales (MPAS) (Park et al., 2014; Skamarock et al., 2012; Skamarock et al., 2014), to accurately predict typhoons in the Northwest Pacific (Kang et al., 2017). For typhoons that influenced the Korean Peninsula from 2015~2017, this MPAS model achieved the best performance in typhoon track predicting (Kang et al., 2017). The typhoon track information was also extracted, such as the location of the typhoon center, maximum wind, and radius at wind intensities of 34 kt, 50 kt, and 60 kt in the quadrant from the MPAS model in the Automated Tropical Cyclone Forecasting (ATCF) system file format. This ATCF file format is the best track format of the Joint Typhoon Warning Center (JTWC) and can be directly used for the symmetric/asymmetric Holland vortex model of the ADvanced CIRCulation (ADCIRC) model (Luettich and Westerink, 2004) which is used to reproduce storm surges in this study. The tracks predicted by MPAS have wind radii of 34 kt, 50 kt, and 64 kt in each quadrant, enabling asymmetric vortex simulation. Since this MPAS model has a horizontal resolution of about 15 km in the Northwest Pacific, it is difficult to implement a steep wind gradient at the typhoon center. Therefore, like previous studies (Choi et al., 2013; Kim et al., 2020), a meteorological field induced by typhoons is created using a parametric model with the typhoon track information around the center of the typhoon. Then, by embedding the typhoon center meteorological field into the surrounding meteorological fields, i.e., through the blending method, a meteorological field similar to the actual one is formed during a typhoon. A previous study (Yuk and Joh, 2019) on Typhoon Chaba blended the meteorological field from a parametric tropical cyclone model (symmetric Holland vortex model) with the typhoon track forecasted by MPAS and the one produced as the output of MPAS itself. Experiments using this field as a meteorological forcing predicted waves and storm surges in the south coast of Korea with a high degree of accuracy; however, experiments considering the asymmetric typhoon vortex formulation have yet to be performed.
Therefore, in this study, to more accurately predict waves and storm surges caused by typhoons, experiments based on the asymmetric typhoon vortex were implemented using MPAS-predicted typhoon tracks and parametric tropical cyclone models. The results were then compared with symmetric vortex simulation results. In addition, we investigated whether prediction performance was improved by embedding the meteorological field from the symmetric/asymmetric Holland model into the surrounding field. Meanwhile, the best track based hindcast experiment was also performed to examine the prediction performance. We selected Typhoon Chaba in 2016 as a case study to test our improved prediction method.
The ‘Methods’ section introduces the integrated tide-surge-wave model, how to generate meteorological forcing, and the experimental setup. Then, the next sections show the model validation and discuss how to improve wave and storm surge prediction through model result analysis.
2. Methods
2.1 Tide-surge-wave prediction model
We used a tightly two-way coupled tide-surge-wave model, i.e., the ADCIRC and Simulating Waves Nearshore (ADCIRC+SWAN) models (Dietrich et al., 2010) to predict waves and storm surges caused by Typhoon Chaba. The elevation and velocity were computed from the continuity equation in a two-dimensional depth integrated model (ADCIRC-2DDI) and the 2DDI momentum equations, respectively (Luettich and Westerink, 2004). The third-generation spectrum wave model, SWAN model (Booji et al., 1999; Ris et al., 1999) obtains the wave parameters by solving the wave action balance equation and integrating the two-dimensional wave energy spectrum in the frequency and direction domains. The ADCIRC and SWAN models exchange information with each other with the same unstructured grid. ADCIRC passes the input wind, water level, and currents processed by itself to SWAN to gain the wave spectrum by solving the wave action balance equation. Then, the ADCIRC model is driven by radiation stress gradients (Longuet-Higgins and Stewart, 1964) obtained from the SWAN model to compute the water levels and currents. Since there are many studies using ADCIRC+SWAN (Choi et al., 2013; Choi et al., 2018; Kerr et al., 2013; Xie et al., 2016; Yuk et al., 2015), a detailed model description is not be provided here.
The model domain covers the East Sea, Yellow Sea, and a part of the East China Sea. The model grid is unstructured, and thus can be made fine in the target areas and coarse in the other areas. Fig. 1 shows the grid in a part of the model domain. The grid size is at least 10 m in the south coast of Korea (Fig. 1(b)) and gradually increases, reaching about 30 km at the open boundary. The amplitudes and phases of eight tidal constituents (M2, S2, K1, O1, N2, K2, P1, and Q1) were assigned to the open boundary, which were obtained from Oregon State University (OSU) tidal databases (Egbert and Ray, 2003). As the main setting of ADCIRC, we used the default settings of the model, and previous studies (Choi et al., 2013; Choi et al., 2018; Yuk et al., 2015) using these settings have shown reasonable results. As the main setting of SWAN, for all experiments, we set the frequency increment factor, first frequency, and the number of frequencies and directions 1.1, 0.031384 Hz, 31, and 36, respectively. In this study, for the values of other variables, the default settings of SWAN were used.
2.2 Meteorological forcing
Storm surges and waves are caused by meteorological forcing such as wind and surface air pressure. Therefore, wind and surface pressure are used as meteorological inputs for the ADCIRC+SWAN model. The ADCIRC+SWAN model has the several types of meteorological forcing input, e.g., the wind and surface pressure to all nodes at the time specified in the model. Also, this model can be driven by the parametric tropical cyclone models such as symmetric / asymmetric Holland vortex model and generalized asymmetric Holland vortex model (GAHM) (Holland, 1980; Luettich et al., 2018). These parametric models can directly use typhoon track information in ATCF file format. GAHM (Gao et al., 2013; Musinguzi et al., 2019) was developed to realistically consider the asymmetric vortex and intensity of a tropical cyclone. Therefore, this model uses all available isotachs of R34, R50, and R64 (radii of 34 kt, 50 kt, and 64 kt wind) in the four quadrants (NE, SE, SW, and NW). Both hindcast and forecast experiments were performed and compared to evaluate the prediction performance. Table 1 shows the meteorological forcing inputs of the forecast and hindcast experiments.
For the forecast experiments, we selected the parametric tropical cyclone models with the symmetric Holland vortex model and GAHM using the forecast track of the MPAS in ATCF file format. Fig. 1(a) shows the Typhoon Chaba track predicted by the MPAS from 00 UTC on 3 October. Compared to the best track of JWTC, the MPAS underestimated the intensity until about the 1-day forecast (18 UTC on 3 October); however, the predicted typhoon followed the best track well until the 2-day forecast (00 UTC on 5 October). The parametric model with the tropical cyclone track can produce the wind and surface pressure following its track. However, for a more accurate forecast, the wind and surface pressure generated along the track as well as in other areas are required (Choi et al., 2013; Yuk and Joh, 2019). Therefore, we tested the parametric models of the symmetric Holland vortex model and GAHM, and blended the same parametric models and forecasting model for our forecast experiments. Here, the forecasting model used was the MPAS model, and the typhoon track in the parametric model was extracted from the same MPAS model, thus allowing for the two to be blended. We generated the blended meteorological field by combining the wind and surface pressure fields along typhoon eye obtained from a parametric tropical cyclone model with MPAS track and those fields surrounding the typhoon produced by MPAS. According to the previous studies (Kawaguchi and Kawai, 2007; Tanemoto and Ishihara, 2013), the combined variables vc are obtained from Eq. (1):
where vp and vm are the variables by the parametric model and forecast model, respectively. W is the weight at any point shown in Eqs. (2) and (3), as follows:
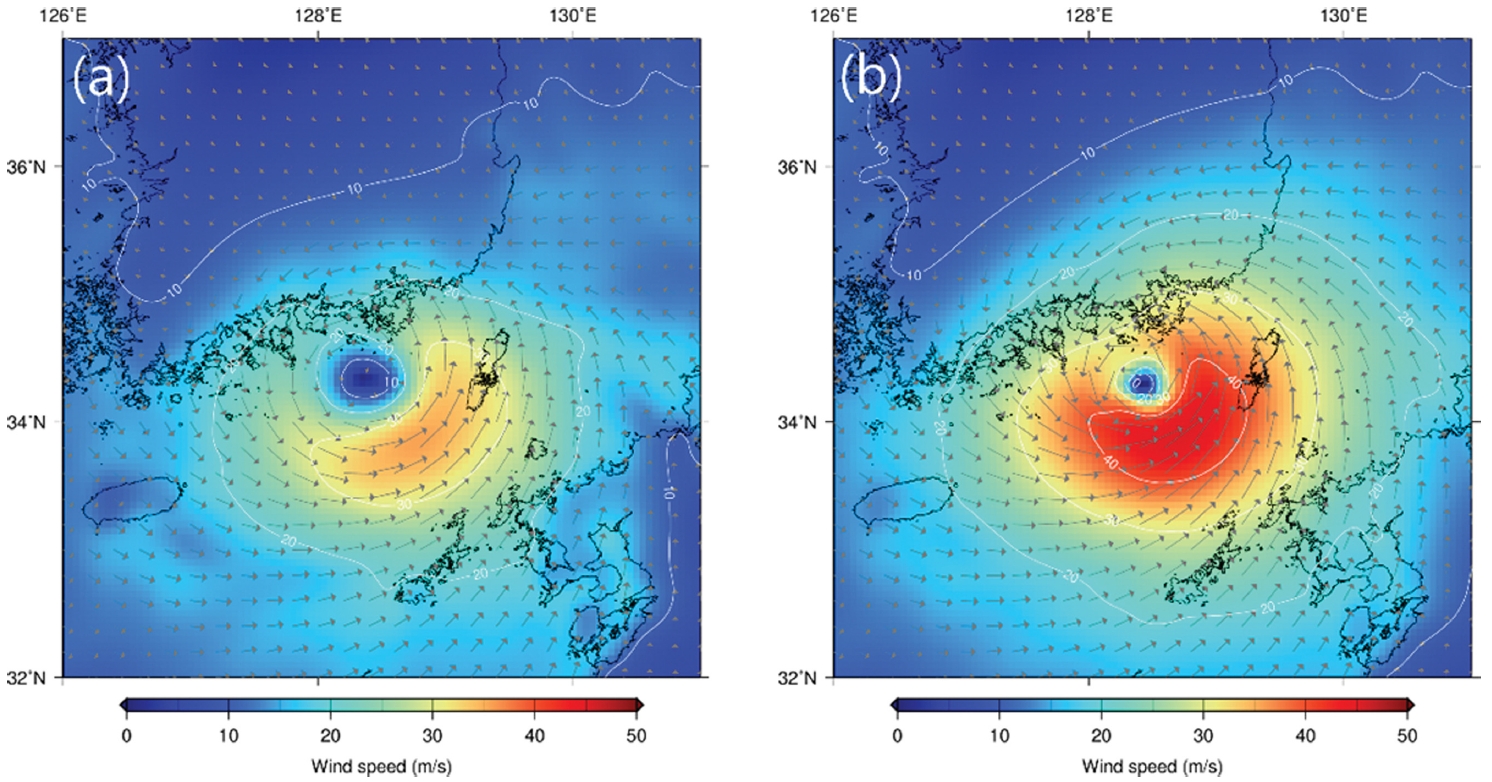
where R15 is the radius at 15 m/s wind, f is the Coriolis parameter, and r is the distance from the center of the typhoon. Fig. 2 shows the blended wind fields 00 UTC on 5 October, using the symmetric Holland vortex (Simulation name of MT-Sy-B) and GAHM (MT-Asy-B). The wind near the center of typhoon was stronger for the asymmetric vortex considering the information of all radii (R34, R50, and R64).
For the hindcast experiments, the parametric models with symmetric and asymmetric vortex methods identical to those used in the forecast experiments were implemented with the typhoon best track of the JTWC including R34, R50, and R64 in the four quadrants. In the hindcast experiments, the blending of the forecasting model and parametric model could not be performed because of the nonexistence of ambient wind and surface pressure data from the forecasting model.
3. Results
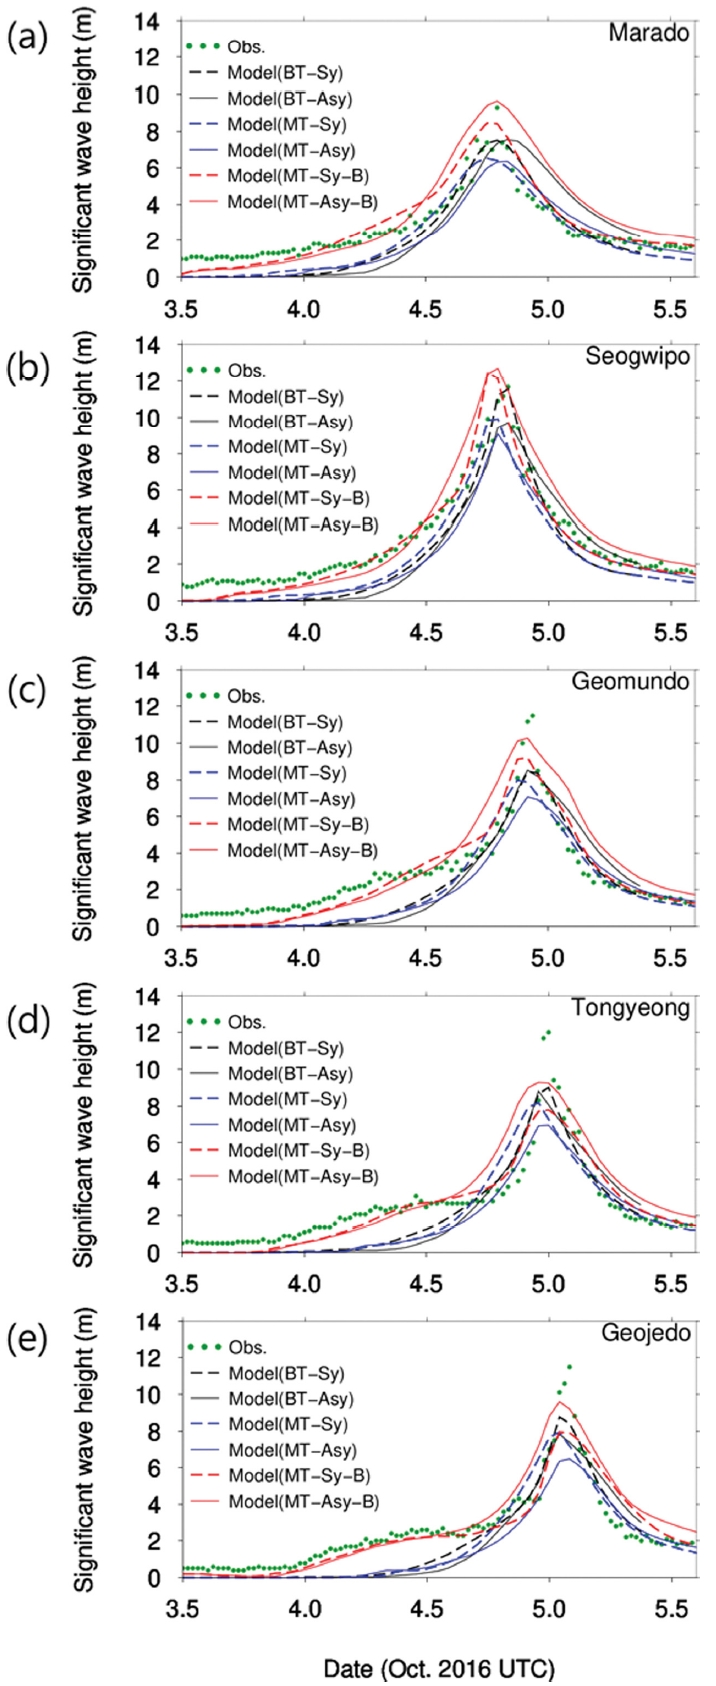
Fig. 3 shows a comparison between the observed and simulated significant wave heights at five wave buoys near the south coast of Korea. Among the five buoys, the models predicted the peak of the significant wave height fairly well at two points in the south: Marado and Seogwipo; however, the models underestimated the peak at the three points in the north: Geomundo, Tongyeong, and Geojedo. The temporal change in significant wave height simulated by the parameter model with the typhoon track of the MPAS showed a similar pattern to that reproduced by the parametric model with the best track.
Table 2 shows the root mean square errors (RMSEs) of significant wave heights for the five buoys from the six experiments listed in Table 1. The RMSE calculated for all five buoys is also shown below. In general, among the six tests, the test using the MPAS track and blending method (MT-B) showed good predictive performance at the five buoys. The symmetric vortex-based experiment performance was slightly better than the asymmetric because the RMSE was low at three points (Marado, Geomundo, and Tongyeong) in the symmetric vortex experiment and at two points (Seogwipo and Geojedo) in the asymmetric vortex experiment. The RMSE for all five points shows that the ‘MT-Sy-B’ case has the best predictive performance.
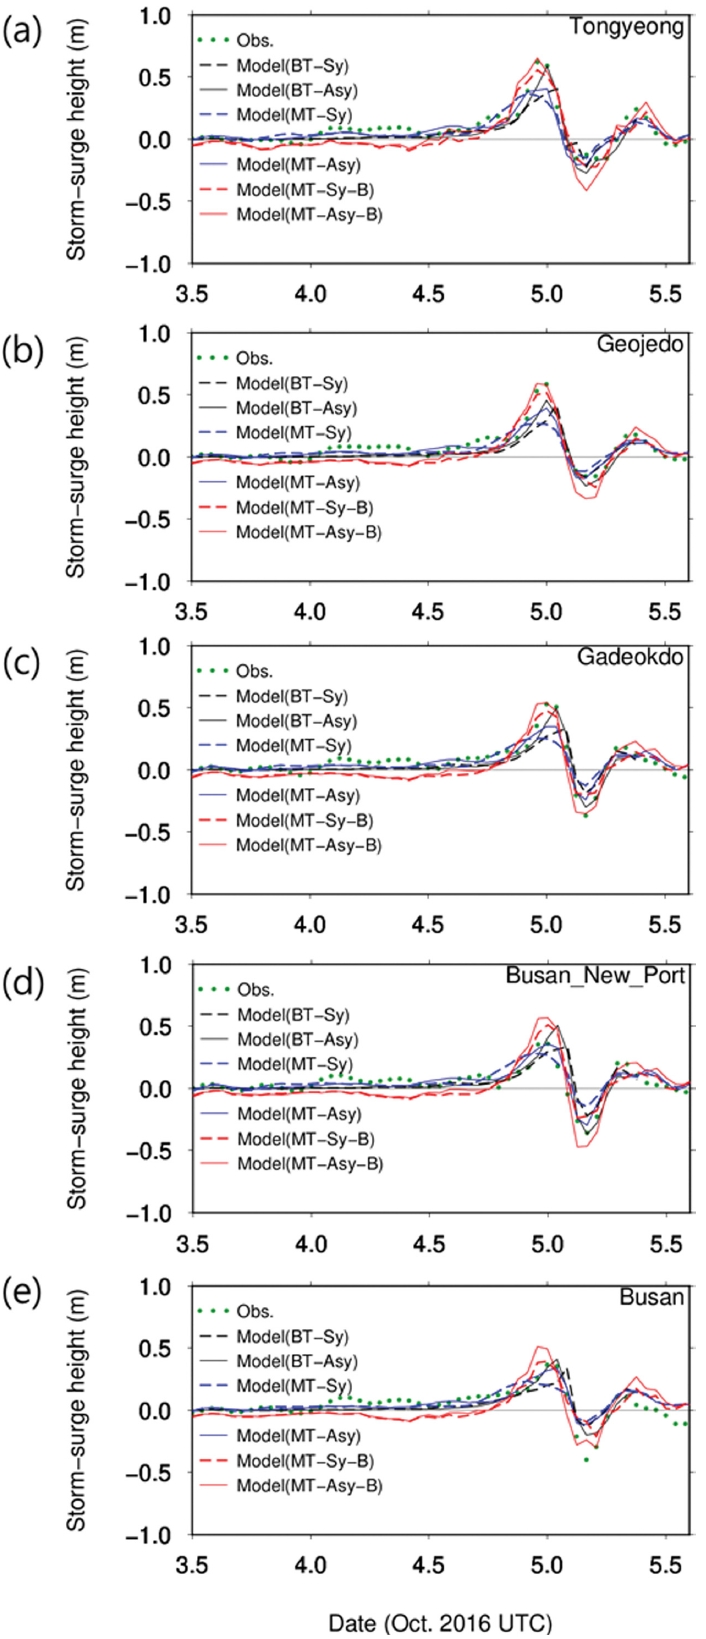
Fig. 4 shows the comparison of the observed and modeled storm surge height at the five tide stations (Fig. 1(b)). When compared with the observed storm surge height, all six experiments with different settings (whether or not the best track and model-forecasted track, symmetric and asymmetric vortices, and blending methods were applied) represented similar temporal changes, e.g., change from a positive to negative storm surge peak.
The RMSEs of the storm surge height for the six tests at the five tide stations are listed in Table 3. The simulation ‘MT-Asy’ showed the best performance not only for each of the five stations, but also for the sum of the five stations.
4. Discussion
4.1 Wind field
The GAHM simulated stronger wind near the typhoon center than the symmetric Holland vortex model (Fig. 2). Since the MPAS typhoon track information at 00 UTC on 5 October showed that the radii of 50 kt and 64 kt in the SE quadrant were larger than those in the other quadrants, GAHM determined a larger intensity in the SE quadrant from the typhoon center. In addition, since the wind field computed by the parametric model was inserted into the surrounding wind field, which was the forecast model result, the area near the center of the typhoon represents the typhoon-induced wind distribution from the parametric model, and the area outside the center of the typhoon indicates the wind distribution from the forecast model result. This means that a meteorological situation similar to the real one can be produced.
4.2 Significant wave height
We compared the significant wave heights of the 4 forecast experiments and observations at the 5 buoys, as well as the 2 hindcast experiments to find an improvement method that can predict waves more accurately. Regarding the distribution of significant wave heights, the four-parametric model (BT/MT-Sy/Asy) adequately predicted the maximum significant wave height without showing a significant difference from the observed value. Compared to using the MPAS-forecasted track (MT-Sy/Asy), the best track experiments (BT-Sy/Asy) predicted the peak significant wave height better. For the entire period, the RMSEs of the forecasts using the MPAS track were not significantly different from the RMSEs of the hindcasts, indicating substantial predictive performance of the significant wave height using the MPAS-forecast track.
As for the difference between symmetric and asymmetric vortices, the symmetric vortex case was generally better for both the best track and MPAS track, but the difference between the two was not significant. In addition, when only the parametric model is used, since there is only a meteorological field near the center of the typhoon, the significant wave height due to the meteorological field outside the typhoon influence area cannot be simulated. Therefore, the parametric model did not simulate a significant wave height that slowly rises before the peak significant wave height (Fig. 3). When blending was applied (comparison of MT-Sy/Asy and MT-Sy/Asy-B), RMSEs became smaller regardless of the symmetric and asymmetric condition. Regarding the significant wave height change during the typhoon, the case (MT-Sy/Asy-B) employing the track and blending method was closely correlated with the observed value. Also, in terms of the highest significant wave heights, the experiment where the GAHM with MPAS track and the blending (MT-Asy-B) were applied was almost identical to the highest observation. Here, the asymmetric vortex experiment showed better scores with 2 buoys, and the symmetric experiment with 3 buoys; therefore, it seems that the effects of symmetry and asymmetry are inconsequential for predicting the significant wave height. To accurately predict significant wave heights caused by typhoons, it is necessary to use not only the wind field showing rapid changes near the center of the typhoon, but also the wind field outside the typhoon influence area.
4.3 Storm surge
Since Typhoon Chaba caused severe damage to the southern coast, storm surge prediction performance was evaluated through the same method as the significant wave height analysis at the five representative tide stations in the southern coast.
Regarding the storm surge distribution, the four parametric models (BT/MT-Sy/Asy) show good agreement with the observations for the positively maximum storm surge. For the entire period at the five stations, the RMSE of the forecast using the MPAS track was slightly smaller than the RMSE of the hindcast; thus, the performance of predicting storm surges using only the MPAS track is slightly better. Regarding the effects of the symmetric and asymmetric vortices, in the experiment using the best track, the experiment using the symmetric method generally shows better results, whereas in the experiment using the MPAS track, the experiment using the asymmetric effect shows remarkably improved results (Table 3). When blending is applied, i.e., when MT-Sy/Asy and MT-Sy/Asy-B are compared, the RMSE is higher for both symmetric and asymmetric experiments. Therefore, in this study, it can be understood that storm surge prediction performance is reduced when blending is used. However, comparing the RMSE of the storm surge predicted by blending (MT-Sy/Asy-B) with that of best track (BT-Sy/Asy), MPAS is generally slightly smaller than the RMSE of the storm surge reproduced using the best track. Therefore, using blending does not significantly degrade storm surge prediction performance.
The storm surge prediction performance is the best when using the GAHM with the MPAS-forecasted track. In addition, even if the GAHM-based meteorological field is blended with the meteorological field derived from the forecasting model, it is comparable to the hindcast using the best track. Therefore, storm surge prediction using the typhoon track from the meteorological model, MPAS and meteorological data from that model are reliable.
5. Conclusions
In this study, to accurately predict the storm surge and waves caused by Typhoon Chaba in 2016, prediction improvement using a forecasting model and symmetric/asymmetric vortex-based parametric models was presented. In addition, this prediction experiment was compared with the best track-based hindcast experiment to examine the reliability of the prediction method.
As for wave prediction, when the meteorological field created by blending the meteorological field generated by using the parametric model with the MPAS track and the meteorological field generated from the MPAS itself was used, the forecasting performance was the best. Furthermore, we found that the difference between symmetry and asymmetry was insignificant. For storm surge prediction, using GAHM with the MPAS track had the best prediction performance. Compared to the best track-based hindcast experimental results, blending slightly reduces the prediction accuracy, but is acceptable. Therefore, the wave and storm surge predictions can be improved by using the MPAS-forecasted track, the meteorological field calculated by GAHM with that track, the meteorological field produced by the same forecasting model, MPAS, and blending. In this study, an experiment and an in-depth analysis of one typhoon case were conducted, but in the next study, we plan to build a more reliable prediction model by applying it to other typhoons that have damaged the Korean coast.