Boonyong, Park, and Kim: Analytical Parametric Study on Pullout Capacity of Embedded Suction Anchors
Abstract
The Embedded Suction Anchor (ESA) is a type of permanent offshore foundation that is installed by a suction pile. To increase the loading capacity against pullout, three wings (vertical flanges) are attached along the circumference at 120 degrees apart. Analytical parametric study using the proposed analytical solution method has been conducted to identify the effects of several parameters that are thought to influence the behavior of ESAs. The analysis results show that the pullout capacity increases as the anchor depth and the soil strength increase, and decreases as the load inclination angle increases. The anchor having square projectional area and being pulled horizontally at the middle of its length provides the highest pullout capacity.
핵심용어: embedded suction anchor, suction pile, pullout capacity, offshore foundation, 매입된 석션앵커, 석션파일, 인발력, 해안구조물기초
1. Introduction
The ESA is a type of permanent offshore foundation that is installed by a suction pile. During installation, the ESA is attached at the tip of the suction pile and then driven as a unit with the suction pile by applying reduced pressure inside the suction pile. Once the ESA reaches the desired depth, the suction pile is retrieved by applying a positive pressure, leaving the ESA permanently in the seafloor soil ( Bang et al. 2003). Thereafter, the ESA is pulled with a preset tension to be deployed at its final, permanent position within the seafloor. Due to this method of installation, the cross-sectional shape of the ESA is circular with its diameter being same as that of the suction pile used to drive it into the seafloor. To increase the resistance against pullout, three rectangular wings (vertical flanges) are attached along the circumference at 120 degrees apart as shown in Fig. 1. The main advantages of ESAs over conventional plate anchors include:
1) During deployment, the ESA retains higher stability due to its geometric symmetry. 2) The ESA can have very large dimensions. 3) The ESA can be installed at great depths.
Fig. 1.
Schematic diagrams of embedded suction anchor.
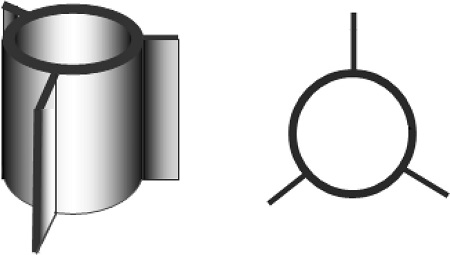
Therefore, the ESA can resist a much higher pullout load than the conventional plate anchors, resulting in substantial savings for the underwater anchor construction.
2. Problem Definition
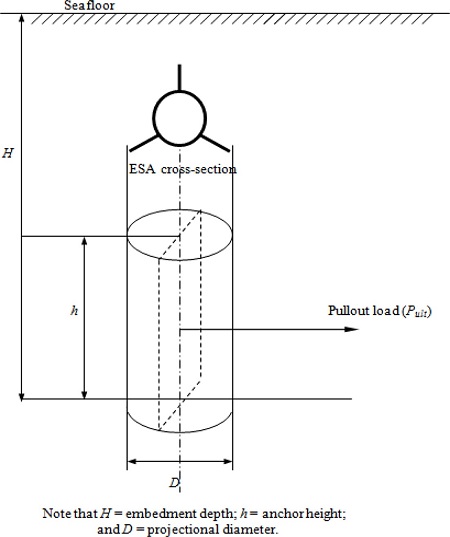
After being installed by a suction pile, the ESA is embedded along the vertical direction in the seafloor, which can be either sand or silt or clay. The ESA has a cylindrical shape with three rectangular flanges, being different from conventional plate anchors. In order to analyze the pullout capacity of the ESA, it is assumed that the ESA is transformed to a rectangular plate anchor having the same projectional area or transformed to a cylindrical anchor having the same projectional diameter. Thus, the problem can be simplified as the pullout capacity of rectangular plate anchors or cylindrical anchors embedded in the seafloor.
Figs. 2 and 3 show the anchor system and the shape of the ESA after this geometric transformation, respectively. After deployment, the ESAs are typically pulled horizontally or almost horizontally by a mooring line, which transfers the tension force to the anchor.
Fig. 2.
Transformed plate anchor.
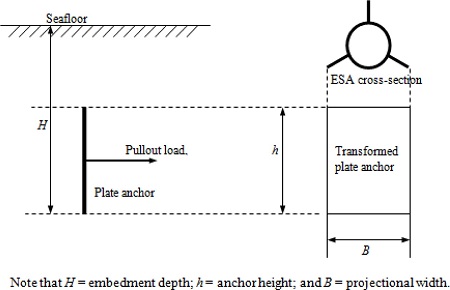
Fig. 3.
Transformed cylindrical anchor.
3. Previous Studies
Numerous studies have been conducted in the past on the pullout capacity of plate anchors installed vertically or horizontally in sand or clay. The majority of the studies are empirical or semi-empirical in nature, based on experimental model test results by Das et al. (1986), Dickin (1988) and Hueckel (1957). There are however very few studies that have rigorous analytical basis. Types of anchors studied in the past include strip, circular and rectangular anchors. It is also noted that the behavior of plate anchors embedded in sand has been studied more than that in clay.
3.1 Navy Method
Beard and Lee (1975) and Beard (1979) developed an equation to predict the vertical pullout capacity of horizontal plate anchors. It utilizes the conventional bearing capacity equation proposed by Vesic with the shape factor proposed by Skempton.
where, F : vertical pullout capacity
A : projectional area of anchor
c : soil cohesion
γb : soil buoyant unit weight
D : embedment depth
B : anchor width or diameter
L : anchor length
Nc, Nq : bearing capacity factors.
The above equation can be used for both deep and shallow anchors embedded in either sand or clay. The term
CNc̅ represents the effect of soil cohesion and the term
γbDN─q
represents the effect of soil overburden. Note that for short term case soil cohesion is soil undrained shear strength.
3.2 Plate Anchors Embedded in Sand and Clay
Mariupol’skii (1965) presented a theory for the vertical pullout capacity of horizontal circular anchor foundations. For shallow anchor foundations, the weights of the soil in the failure zones above the foundations and the friction force along the failure surfaces produce the pullout capacity. Based on the design diagram for a shallow anchor foundation, the ultimate vertical pullout capacity Pl of shallow anchors can be calculated from
where, G1 : anchor weight
R : anchor radius
Ro : column radius
γ : soil unit weight
h : anchor depth
c : soil cohesion
n : dimensionless coefficient
f : soil frictional angle
ξ : coefficient of lateral earth pressure
For deep anchors, the vertical pullout capacity can be obtained from the following assumption. The work of withdrawing the anchor plate to height was assumed to be equivalent to the work expended for expanding a certain cylindrical cavity in the soil of radius Ro and height to radius R. The ultimate vertical pullout capacity Pl of deep anchors can be calculated from
where, Pp : Ngㆍhp(R2-
R02
)
f : specific friction resistance of soil along the lateral of the anchor stem.
4. Analytical Solution of ESA Pullout Capacity
Currently, there are no available solution methods that consider the point of the lateral load application on the pullout capacity of vertical anchors. In addition, virtually all currently available solution methods are based on two-dimensional behaviors of the soil. Therefore, it is imperative to develop a solution for the pullout capacity of ESAs that considers the effects of the point of the lateral load application and the three-dimensional soil stresses. Included in this section is an analytical solution that can analyze the pullout capacity of deeply buried vertical cylindrical anchors in sand or clay under either horizontal or inclined load. The analytical solution developed by Dr. Sangchul Bang at SDSM&T ( Bang, 1996) can be applied to estimate the pullout capacity of ESA by transforming the ESA geometry into an equivalent cylinder that has the same projectional diameter as the ESA as shown in Figs. 2 and 3.
4.1 Pullout Capacity of Circular Pile
The solution for the pullout capacity of a vertical circular pile was established from the consideration of the development of three-dimensional normal and shear stresses along the surface of the pile. It was assumed that the soil was homogeneous and isotropic, and that the pile was rigid. The ultimate horizontal capacity was, consequently, obtained from the force and moment equilibrium conditions. When the pile is pulled horizontally, the pile can either rotate or translate depending on the amount of pullout load and the location of the horizontal loading on the pile. Passive stress and active stress can develop according to the direction of the pile movement, i.e., passive stress is developed along the advancing side of the pile and active stress is developed behind the pile. The forces include the passive-side normal and tangential forces, the active-side normal and tangential forces and the forces at the tip.
4.2 Ultimate Resistance of Soil
To calculate the horizontal pullout capacity of the circular pile, the ultimate resistance of soil is assumed to be equal to the ultimate bearing capacity of a deeply buried foundation. Fig. 4 shows the assumed failure surface for the vertical circular pile. The failure surface is same as for the conventional bearing capacity theories. However, the surcharge acting along the centerline of the anchor is assumed to be the lateral earth pressure at rest ( σo),
Fig. 4.
Assumed failure surface of the pile (top view).
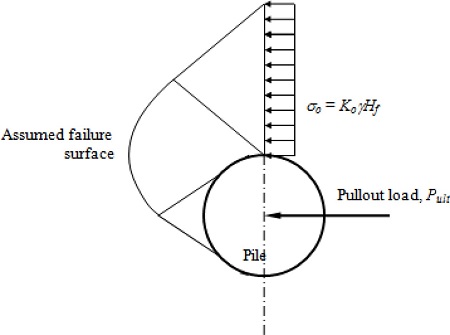
where, Ko : coefficient of lateral earth pressure at rest
γ : soil unit weight
Hf : depth from the sea floor to the centroid of pile segment
The conventional bearing capacity theory utilizes the following equation for the estimation of the ultimate bearing capacity.
where, qult : ultimate bearing capacity
c : soil cohesion
q=γDf : overburden pressure at the bottom of the foundation
Df : depth from the ground surface to the bottom of the foundation
B : width of the footing
γ : soil unit weight
Nc, Nq, Ng : bearing capacity factors
To account for different shapes of footings, buried depths and load inclination angles, Meyerhof (1973) suggested the following general bearing capacity equation.
where, Fcs,Fqs,Fgs : shape factors
Fcd,Fqd,Fgd : depth factors
Fci,Fqi,Fgi : load inclination factors
Table 1 shows the typical values of the bearing capacity factors as function of the soil friction angle.
Table 1.
|
ф
|
Nc′ |
Nq′ |
Nγ′ |
ф
|
Nc′ |
Nq′ |
Nγ′ |
|
0 |
5.70 |
1.00 |
0.00 |
26 |
15.53 |
6.05 |
2.59 |
|
1 |
5.90 |
1.07 |
0.005 |
27 |
16.30 |
6.54 |
2.88 |
|
2 |
6.10 |
1.14 |
0.02 |
28 |
17.13 |
7.07 |
3.29 |
|
3 |
6.30 |
1.22 |
0.04 |
29 |
18.03 |
7.66 |
3.76 |
|
4 |
6.51 |
1.30 |
0.055 |
30 |
18.99 |
8.31 |
4.39 |
|
5 |
6.74 |
1.39 |
0.075 |
31 |
20.03 |
9.03 |
4.83 |
|
6 |
6.97 |
1.49 |
0.10 |
32 |
21.16 |
9.82 |
5.51 |
|
7 |
7.22 |
1.59 |
0.128 |
33 |
22.39 |
10.69 |
6.32 |
|
8 |
7.47 |
1.70 |
0.16 |
34 |
23.72 |
11.67 |
7.22 |
|
9 |
7.74 |
1.82 |
0.20 |
35 |
25.18 |
12.75 |
8.35 |
|
10 |
8.02 |
1.94 |
0.24 |
36 |
26.77 |
13.97 |
9.41 |
|
11 |
8.32 |
2.08 |
0.30 |
37 |
28.51 |
15.32 |
10.90 |
|
12 |
8.63 |
2.22 |
0.35 |
38 |
30.43 |
16.85 |
12.75 |
|
13 |
8.96 |
2.38 |
0.42 |
39 |
32.53 |
18.56 |
14.71 |
|
14 |
9.31 |
2.55 |
0.48 |
40 |
34.87 |
20.50 |
17.22 |
|
15 |
9.67 |
2.73 |
0.57 |
41 |
37.45 |
22.70 |
19.75 |
|
16 |
10.06 |
2.92 |
0.67 |
42 |
40.33 |
25.21 |
22.50 |
|
17 |
10.47 |
3.13 |
0.76 |
43 |
43.54 |
28.06 |
26.25 |
|
18 |
10.90 |
3.36 |
0.88 |
44 |
47.13 |
31.34 |
30.40 |
|
19 |
11.36 |
3.61 |
1.03 |
45 |
51.17 |
35.11 |
36.00 |
|
20 |
11.85 |
3.88 |
1.12 |
46 |
55.73 |
39.48 |
41.70 |
|
21 |
12.37 |
4.17 |
1.35 |
47 |
60.91 |
44.45 |
49.30 |
|
22 |
12.92 |
4.48 |
1.55 |
48 |
66.80 |
50.46 |
59.25 |
|
23 |
13.51 |
4.82 |
1.74 |
49 |
73.55 |
57.41 |
71.45 |
|
24 |
14.14 |
5.20 |
1.97 |
50 |
81.31 |
65.60 |
85.75 |
|
25 |
14.80 |
5.60 |
2.25 |
|
|
|
|
4.3 Solution for Ultimate Pullout Capacity
A brief description of the solution procedure for the ultimate pullout capacity, incorporating the formulations is provided below ( Cho, 2001).
-
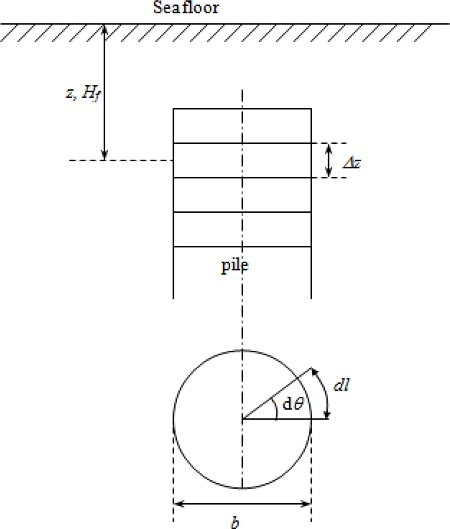
1) The pile is initially divided into a certain number of segments of equal length (Δz, Fig. 5). The ultimate horizontal pullout capacity is then obtained as described previously. Additional solutions of the pullout capacity are also obtained using more numbers of pile segments. If the two results are close enough, the solution process stops. Otherwise, the process continues with an increasing number of pile segments until the results with two consecutive different numbers of pile segments agree reasonably.
Fig. 5.
Segments of the pile.
2) The solution follows the progressive failure mechanism. At the beginning, the soil elements along the entire length of the pile are assumed to be elastic. Then the failure starts from either end of the pile and propagates toward the middle as the ESA rotation increases until the maximum horizontal pullout load is obtained. 3) The ultimate horizontal pullout capacity is obtained through an iterative search with smaller increments of soil yield factor, μ (thickness of soil failure zone), until the results with two consecutive μ values agree reasonably. Additionally, at a given thickness of the failure zone, the pile rotation factor (η) varies from a large negative number to a large positive number to incorporate the cases when the pile experiences mostly translation with slight rotation. 4) The pile rotation factor (η) and the soil yield factor (μ) are searched systematically until the true solution is found. It is possible that several potential solutions that satisfy all equilibrium requirements exist at given values of η and μ. However, the true solution is the largest among them.
5. Parametric Study
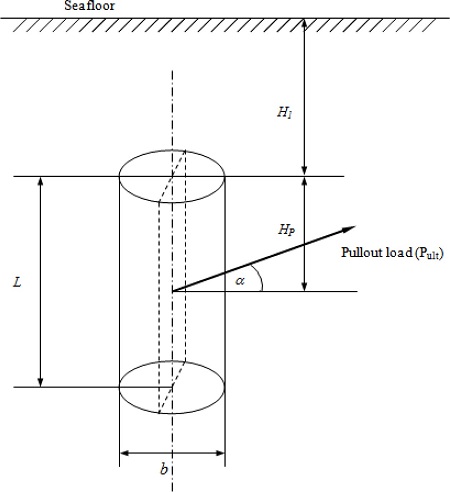
Many parameters influence the pullout capacity of vertical circular pile anchors, including the geometric of the anchor, the soil properties and the loading condition. To investigate the effects of these parameters on the pullout capacity, an analytical parametric study has been conducted using the developed solution method. The parameters selected for this study include the anchor depth (H1), the lateral loading position (HP), the load inclination angle (α), the soil undrained shear strength (su), the soil friction angle (ф), and the aspect ratio (b/L; b: anchor diameter, and L: total anchor length).
The standard parameters used in the parametric study are described below.
Anchor geometry:
Anchor depth (H1) = 4.88 m
Anchor diameter (b) = 1.52 m
Anchor length (L) = 2.44 m
Lateral loading position (Hp) = 1.22 m
Load inclination angle (α) = 0°
Soil properties:
Sand: Friction angle (ф) = 30°
Saturated unit weight (γsat) = 15.7 kPa
Clay: Soil undrained shear strength (Su) = 23.9 kPa
Saturated unit weight (γsat) = 15.7 kPa
Fig. 6 shows the geometric parameters of the vertical circular pile anchor. It is assumed that the soil is homogeneous and isotropic.
Fig. 6.
Geometric diagram of vertical circular pile anchor.
5.1 Effect of Anchor Depth
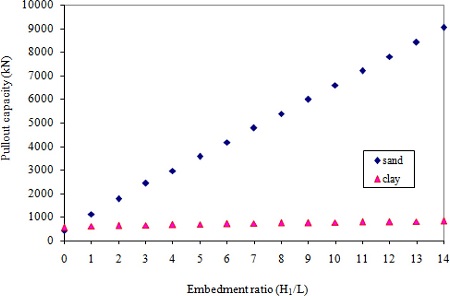
The horizontal pullout capacity of vertical anchors is expected to increase with the depth of the anchor ( H1). To investigate the effect of the anchor depth, the embedment ratio ( H1/ L) was varied from 0 to 14. The results of the analysis, with the standard parameters and various embedment ratios, are shown in Fig. 7 for the anchor embedded in sand and for the anchor embedded in clay. As expected, the pullout capacity of the anchor embedded in sand or clay increases with the increase in embedment ratio. With sand, the variation of the pullout capacity with respect to the embedment ratio is almost linear. The pullout capacity is minimum of 418 kN at the zero depth and increases to 9025 kN at the embedment ratio of 14. With clay, the pullout capacity is minimum of 560 kN at the zero depth and increases to 836 kN at the embedment ratio of 14. The pullout capacity of the anchor embedded in sand increases very rapidly than that in clay as the embedment ratio increases, indicating the depth dependent characteristic of sand. The anchor depth has more influence on the pullout capacity with sand than with clay. When the anchor depth is increased from zero to 14L, the pullout capacity is increased by approximately 21.5 times with sand. With clay, the corresponding increase is only 49%.
Fig. 7.
Pullout capacity vs. embedment ratio (H1/L) with sand & clay.
5.2 Effect of Lateral Loading Position
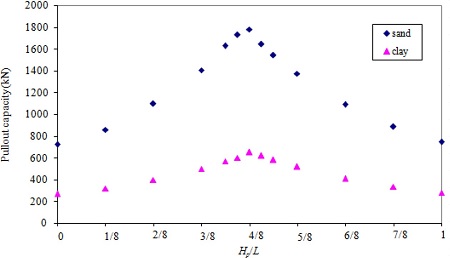
To investigate the effect of the loading position, the loading point was moved from the top to the bottom of the anchor, i.e., Hp/L were varied from zero to one. Results of the analysis, with the standard parameters and various loading positions, are shown in Fig. 8 for the anchor embedded in sand and for the anchor in clay. As can be seen in the figure, the pattern of the pullout capacity variation with respect to Hp/L for the anchors embedded in sand or clay is more or less the same. The pullout capacity increases as the loading point approaches from either end of the anchor to the middle of the anchor. In sand, the maximum pullout capacity of 1779 kN is observed when the anchor is loaded at 0.5 L below the top of the anchor. In clay, the maximum pullout capacity of 649 kN is also observed when the anchor is loaded at 0.5 L below the top of the anchor. These indicate that the maximum pullout capacity can be obtained when the anchor is loaded near the mid-point. Additionally, comparison between the pullout capacities with sand and clay indicates that the rate of change in the pullout capacity with sand is greater than that with clay, indicating that the change of the loading position has more influence on the pullout capacity of the anchor embedded in sand than that in clay. When the loading position is moved from the top to 0.5 L, the pullout capacity is increased by approximately 147% with sand. With clay, the corresponding increase is 143%.
Fig. 8.
Pullout capacity vs. Hp/L with sand and clay.
5.3 Effect of Load Inclination Angle
To study the effect of the load inclination angle, the load inclination angle ( α) was varied from 0°to 30°. Results of the analysis are shown in Fig. 9 for the anchor embedded in sand and for that in clay. As observed previously, the pullout capacity decreases with an increase in the load inclination angle for the anchor embedded in sand or clay. In sand, the maximum pullout capacity of 1779 kN is observed at α = 0°and the minimum of 672 kN is observed at α = 30°. In clay, the maximum pullout capacity of 649 kN is observed at α = 0°, and the minimum of 343 kN is observed at α = 30°, i.e., the steepest load inclination angle considered. The pullout capacity with sand is more sensitive with the change in the load inclination angle than that with clay as shown in Fig. 9. When the load inclination angle is increased from 0°to 30°, the pullout capacity is reduced by approximately 62% with sand. With clay, the corresponding reduction is 47%.
Fig. 9.
Pullout capacity vs. load inclination angle (α) with sand clay.

5.4 Effect of Soil Undrained Shear Strength and Friction Angle
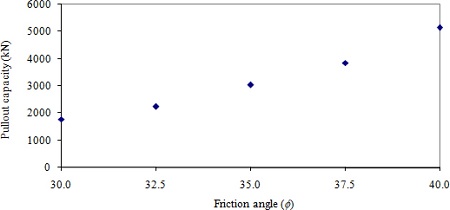
Shear strength of the soil is dictated by the cohesion and friction. It is obvious that the change in soil strength influences the horizontal pullout capacity of the vertical anchors. To investigate the effect of the soil strength, five different soil undrained shear strengths and five different soil friction angles were chosen. The selected soil undrained shear strengths ( su) were 12, 24, 36, 48, and 60 kPa and the selected soil friction angles ( ф) were 30, 32.5, 35, 37.5 and 40 degrees. Results of the analysis are shown in Fig. 10 for the anchor embedded in clay and in Fig. 11 for that in sand. As expected, the pullout capacity increases as su and f increase. The variation of the pullout capacity with respect to su is almost linear. The minimum pullout capacity of 343 kN is observed with the undrained shear strength of 12 kPa. The pullout capacity reaches its maximum value of 1570 kN with the undrained shear strength of 60 kPa, which is about 4.6 times greater than when the undrained shear strength is 12 kPa. With sand, the variation of the pullout capacity with respect to the friction angle is concave. The maximum pullout capacity of 5147 kN is observed at the friction angle of 40°, which is about 2.9 times greater than the minimum value of 1779 kN observed at the friction angle of 30°.
Fig. 10.
Pullout capacity vs. soil undrained shear strength.

Fig. 11.
Pullout capacity vs. friction angle.
5.5 Effect of Aspect Ratio
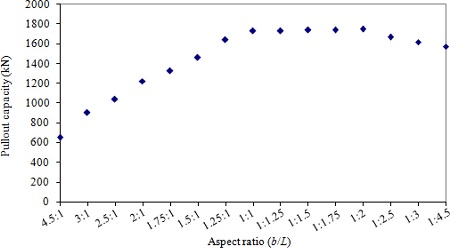
Square plate anchors were found to be the most efficient anchor among all shapes of plate anchors. It is indicated that the pullout capacity gradually decreases as the shape of a plate anchor transits from square to strip, which produces the lowest pullout capacity. To investigate the effect of the anchor shape on the horizontal pullout capacity of the vertical circular pile anchors, 15 aspect ratios ( b/L) were selected. The selected aspect ratios include 4.5:1, 3:1, 2.5:1, 2:1, 1.75:1, 1.5:1, 1.25:1, 1:1, 1:1.25, 1:1.5, 1:1.75, 1:2, 1:2.5, 1:3 and 1:4.5. The total projectional area of the anchor was fixed at 3.716 m 2. Results of the analysis are shown in Fig. 12 for the anchor embedded in clay and Fig. 13 for the anchor embedded in sand. In clay, the pullout capacity increases with the aspect ratio, reaches its maximum when the aspect ratio is near 1.25:1, then decreases as the aspect ratio increases further. The change in pullout capacity from the strip shape to square shape is however not significant. For example, the reduction of pullout capacity from b/L of 1:1 to 1:4.5 is approximately 12%. With sand, the pullout capacity with respect to the aspect ratio increases with the aspect ratio initially, reaches its peak when the aspect ratio is near 1:1, stays more or less the same up to the aspect ratio of 1:2, then decreases as the aspect ratio increases further. The decrease in pullout capacity from the square shape to much higher value of b/L is however not significant. For instance, the reduction of pullout capacity for b/L of 1:1 to 1:4.5 is approximately 9 %. It is noted that the change in the pullout capacity is more significant when the aspect ratio increases from 1:1 to much higher values with clay, while with sand the change is more significant with the changes in the aspect ratio less that 1.0. It may be concluded that square anchors would produce the most effective pullout capacity.
Fig. 12.
Pullout capacity vs. aspect ratio (b/L) with clay.
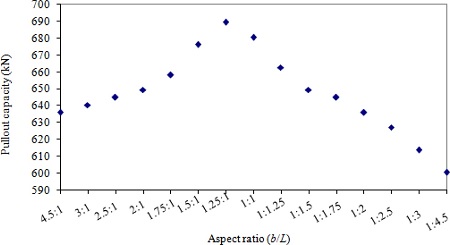
Fig. 13.
Pullout capacity vs. aspect ratio (b/L) with sand.
6. Conclusions
Following observations have been made from the analytical parametric study.
1) The pullout capacity of the vertical anchor increases as the anchor depth (H1) increases. However, the effect is more pronounced with sand than with clay. 2) The pullout capacity reaches maximum when the anchor is loaded near the mid-length of the anchor. The effect is more pronounced with sand than with clay. 3) As the load inclination angle increases, the pullout capacity decreases. The pullout capacity with sand is more sensitive with the change in the load inclination angle than that with clay. 4) As the soil strength increases, the pullout capacity increases. 5) The highest pullout capacity is obtained when the anchor shape is close to square (the aspect ratio of 1:1) for same anchor area.
Therefore, to obtain the highest possible pullout capacity, the anchor should be placed at the greatest depth possible and pulled horizontally near the mid point of the pile with its shape being square. At high stress levels, the ultimate soil friction angle decreases as the stress level increases. Therefore, the variation of the soil friction angle with the stress level may have to be considered in the pullout capacity. For anchors embedded in clay, suction force may develop along the active side of the pile and become significant addition to the short-term pullout capacity. The proposed analytical solution method, however, does not consider the effect of this suction force.
References
1. Bang, S.. (1996). Anchor mooring line computer program user manual, Contract Report CR-6020-OCN Naval Facilities Engineering Service Center.
2. Bang, S., Cho, Y., Kim, Y.S., Kwag, D.J., et al, Lee, T.H. (2003). Embedded suction anchors for floating breakwaters, Coastal Engineering 2003, Cadiz, Spain, 469-477.
3. Beard, R.M.. (1979). Long-term holding capacity of statically loaded anchors in cohesive soils, Technical Report No. TN-1545. Naval Construction Battalion Center; Port Hueneme, CA.
4. Beard, R.M., et al, Lee, H.J. (1975). Holding capacity of direct embedment anchors, Proceedings of the Civil Engineering in the Oceans/III, Delaware: University of Delaware, 1, 470-485.
5. Cho, Y.. (2001). Calibration of installation, analytical performance study, and analytical solution of loading capacity of suction piles. Ph.D Thesis. South Dakota School of Mines and Technology; SD, USA.
6. DAS, B.M.. (1998). Principles of Foundation Engineering. CA: ITP.
7. DAS, B.M., et al, Picornell, M. (1986). Ultimate resistance of vertical plate anchors in clay, Coastal Engineering, 1831-1842.
8. Dickin, E.A. (1988). Uplift behavior of horizontal anchor plates in sand, Journal of Geotechnical Engineering, ASCE, 114(11):1300-1317. 10.1061/(ASCE)0733-9410(1988)114:11(1300).  9. Hueckel, S. (1957). Model tests on anchoring capacity of vertical and inclined plates, Proceedings, 4th International Conference on Soil Mechanics and Foundation Engineering, London, England, 2, 203-206.
10. Mariupol'skii, L.G. (1965). The bearing capacity of anchor foundations, Soil Mechanics and Foundation Engineering, 26-37. 10.1007/BF01704424.  11. Meyerhof, G.G. (1973). Uplift resistance of inclined anchors and piles, Proceedings, 8 th International Conference on Soil Mechanics and Foundation Engineering, Moscow, USSR, 2.1, 167-172. 
|
|


