


1. Introduction
Sedimentation is a natural process of particles settling in the bottom of water bodies whereby these particles are eroded and transported by water flow and deposited mainly in the estuary area. Any imbalance between the transport capacity and the sediment supply rate determines the amount of sediment deposited or eroded in the channel and the associated channel change. Estimation of sediment transport is the basic step to predict the channel changes and it is also an important factor to solve the sedimentation or erosion related problems. Many sediment transport formulae and theories were developed by many scholars since Du Boys (1879) published the first formula for the prediction of bed load transport. Estimation of sediment transport in Yangon River was done in this research paper by using Bagnold (1966) theory regarding the high sedimentation problem that causes huge impact on the cargo trade capacity of the Yangon Port.
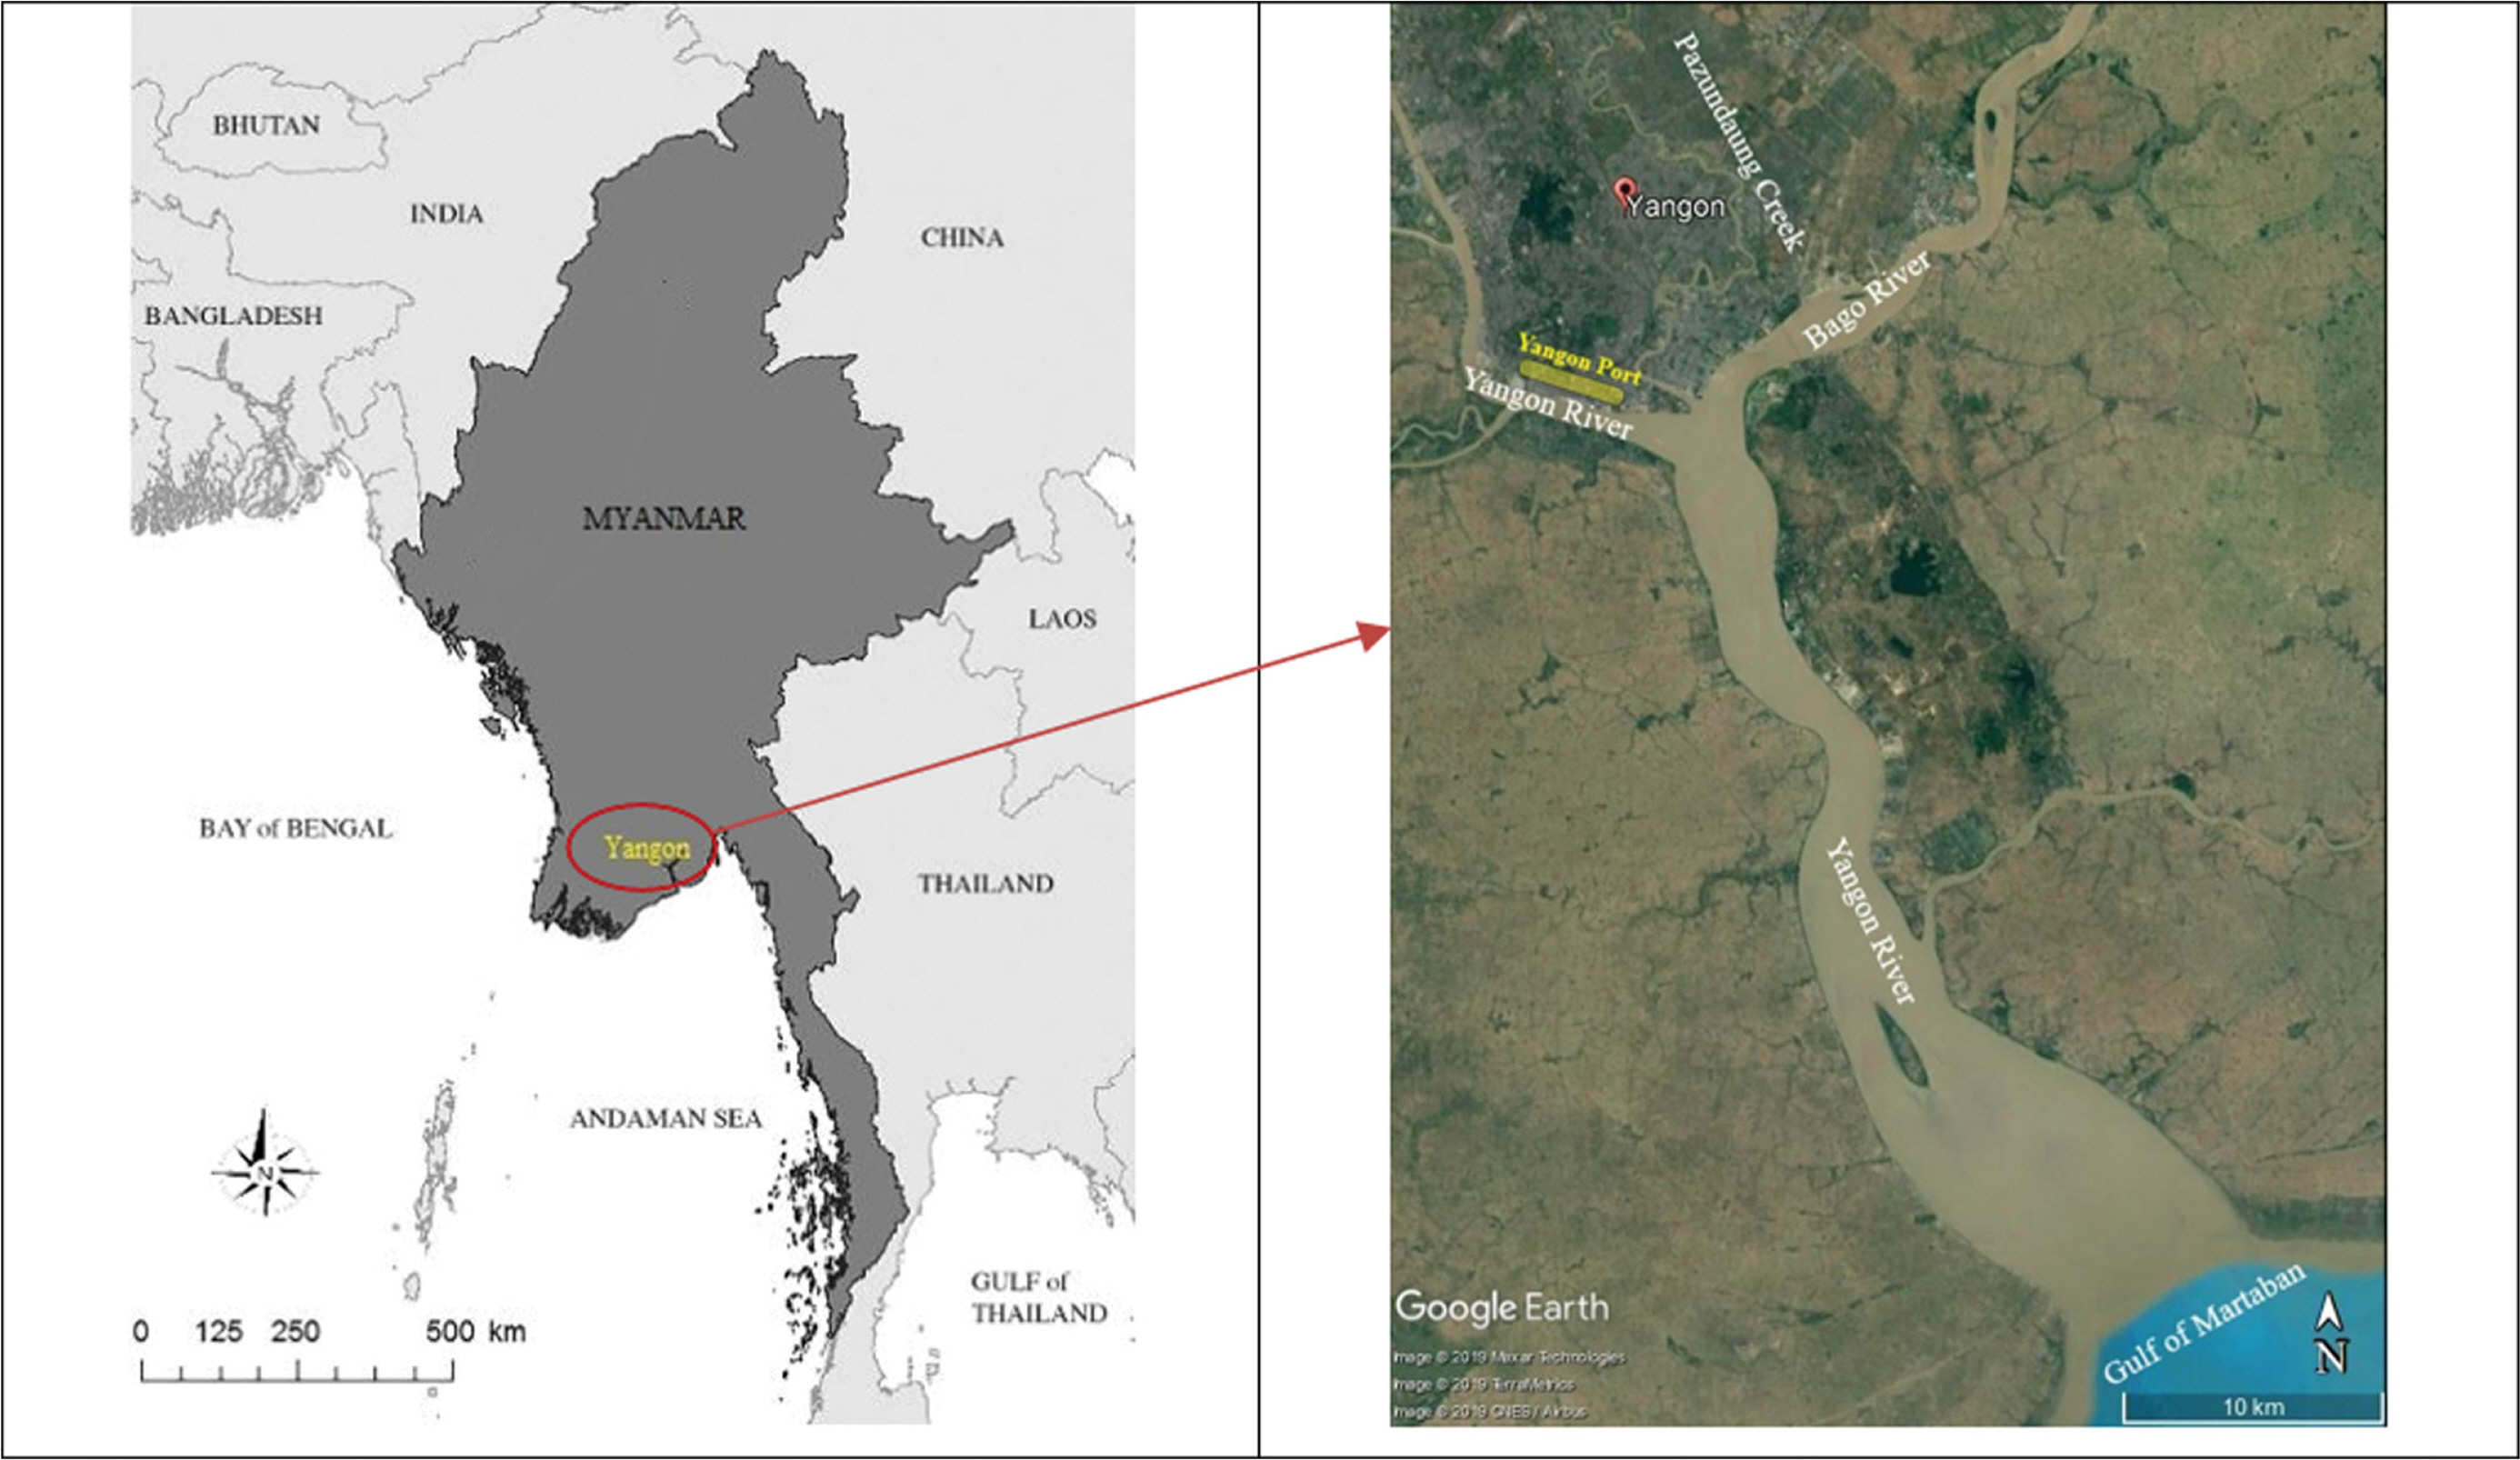
Although there are nine major ports in Myanmar along the coastline of 2228 km, Yangon port is the vital port of Myanmar as it handles about 90% of the country’s export and import. The strategic location of Myanmar between China, India and other ASEAN countries provides easy access to the world’s major shipping lanes and Myanmar could become the axis of the hub for trades and transportations in the region. But, high sedimentation rate in Yangon River becomes one major issue for Myanmar as her largest port is located on the Yangon Riverbank. The size of the vessels calling to Yangon port is limited due to the two shallow water areas named as the inner bar and outer bar along the navigation channel from the river mouth to the Yangon Port.
Regarding the sedimentation issues, behaviors of finegrained sediment in Yangon River was described by Nelson (2000), and flows and sediment transport process in Yangon River was investigated by Aung et al. (2011), Aung et al. (2013) to calculate sedimentation in Yangon River by using 3D Princeton Ocean Model. However, these numerical studies were implemented based on the data by Sir Alexander Gibb and Partners (1974) due to the lack of recent field observation data. In addition, the erosion and sedimentation patterns around the inner bar are studied by Koning and Janssen (2015) with Delft3D-Flow Model. However, they did not provide any calculation results for the sedimentation rate in this area due to lack of observation data. According to Habibi (1994), the accuracy of the calculation result highly depended on the real field observation data used in the calculation, and the transport rates estimated by theories without accurate field measurements would gain no universal acceptance.
In March 2016, Myanma Port Authority (MPA) made a data collection survey report for the improvement of the navigation channel of Yangon port (JICA, 2016). In the present study, the observation data in that report were used to calculate sediment transport in the Yangon River. We believe this study is important as it is first approach to estimate the amount of deposited sediment and to predict the riverbed elevation changes of Yangon River in next 50 years based on the recent observation data available in the research site.
2. Site Characterization
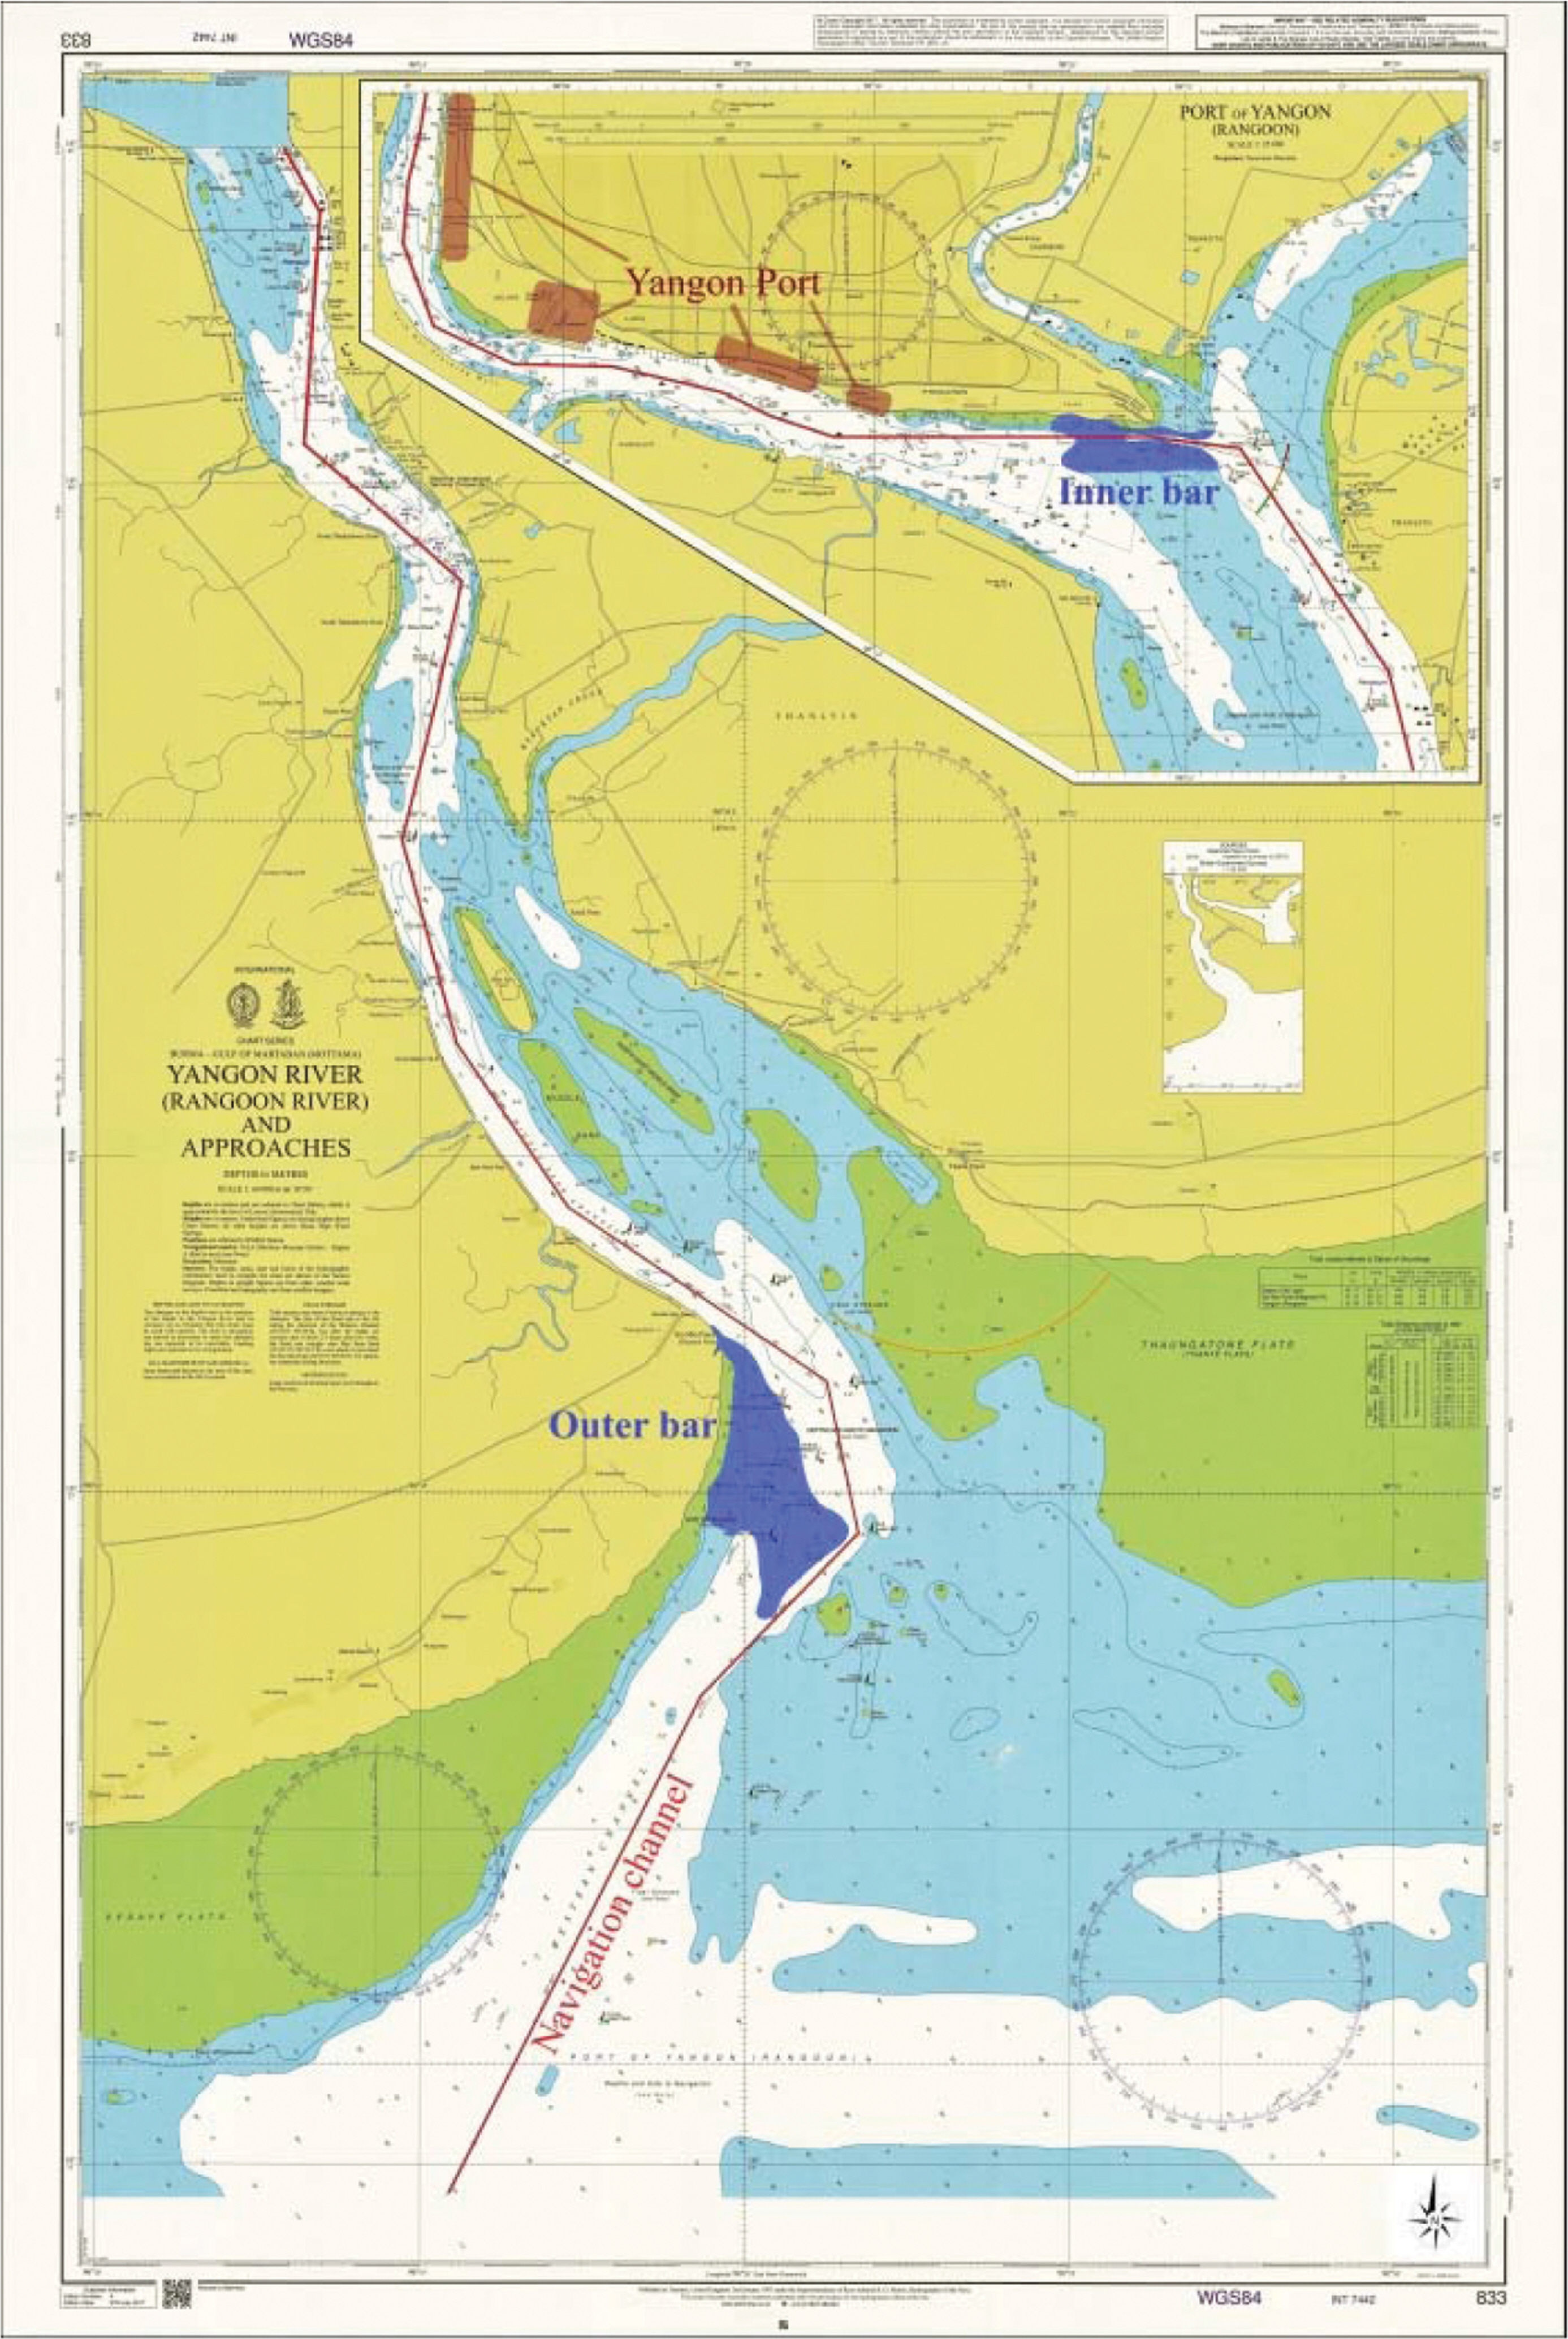
Yangon port is located about 32 km inward from the Elephant point on the Gulf of Martaban, and there are two shallow water areas along the navigation channel, the inner bar area (monkey point) and the outer bar area (elephant point). Most of the sedimentation occurs in these two areas. Available water depth at monkey point and elephant point area at below chart datum is about 4 m and 5 m respectively. These two shallow water areas limit the accessible vessel size to Yangon Port as 167 m Length over All (LOA), 9 m Draft (T), and 15000 Dead Weight Tonnage (DWT). Water level changes between the rainy and dry seasons are approximately 1 m only, and the average tidal range is about 5.85 m at spring tide and 2.55 m at neap tide (MPA,2016). The height of the waves even at the mouth of the river is less than two meters, it does not interrupt the marine operations at the Yangon Port and the average velocity of the current in Yangon River is about 4 to 6 knots (MPA, 2016).
3. Problem Statement
The size of the navigation channel at the inner bar area is about 2.4 km length, 100 m width, and 4.5 m depth below chart datum. All vessels larger than 200 gross tonnages have to wait for the high tide condition to cross the channel to ensure sufficient water depth. That limits the cargo trade capacity of the Yangon Port and slow down the economic development of the country. Daily maintenance dredging works are done by Myanma Port Authority to keep the depth of the navigation channel at 4.5 m by using four trailing suction hopper dredgers. But due to the increased rate of sedimentation in Yangon River, extra dredging works became necessary to maintain the channel. In 2016, MPA had to spend $1.6 million for only 16 days emergency dredging operation and start from 2018, MPA hired private dredging company with $4.95 million per year for the maintenance dredging works. The annual volume of dredged materials at inner bar can be estimated up to 1.4 million cubic meters base on the workload of dredgers. But, that huge amount of workload can only maintain the depth of the channel up to 4.5 m at inner bar area. Comparison between the Chart Map in 1904 and 2015 also prove that the Yangon River is getting shallower and shallower (JICA, 2016).
4. Materials and Methods
4.1 Characteristic of sediment and river flow velocity
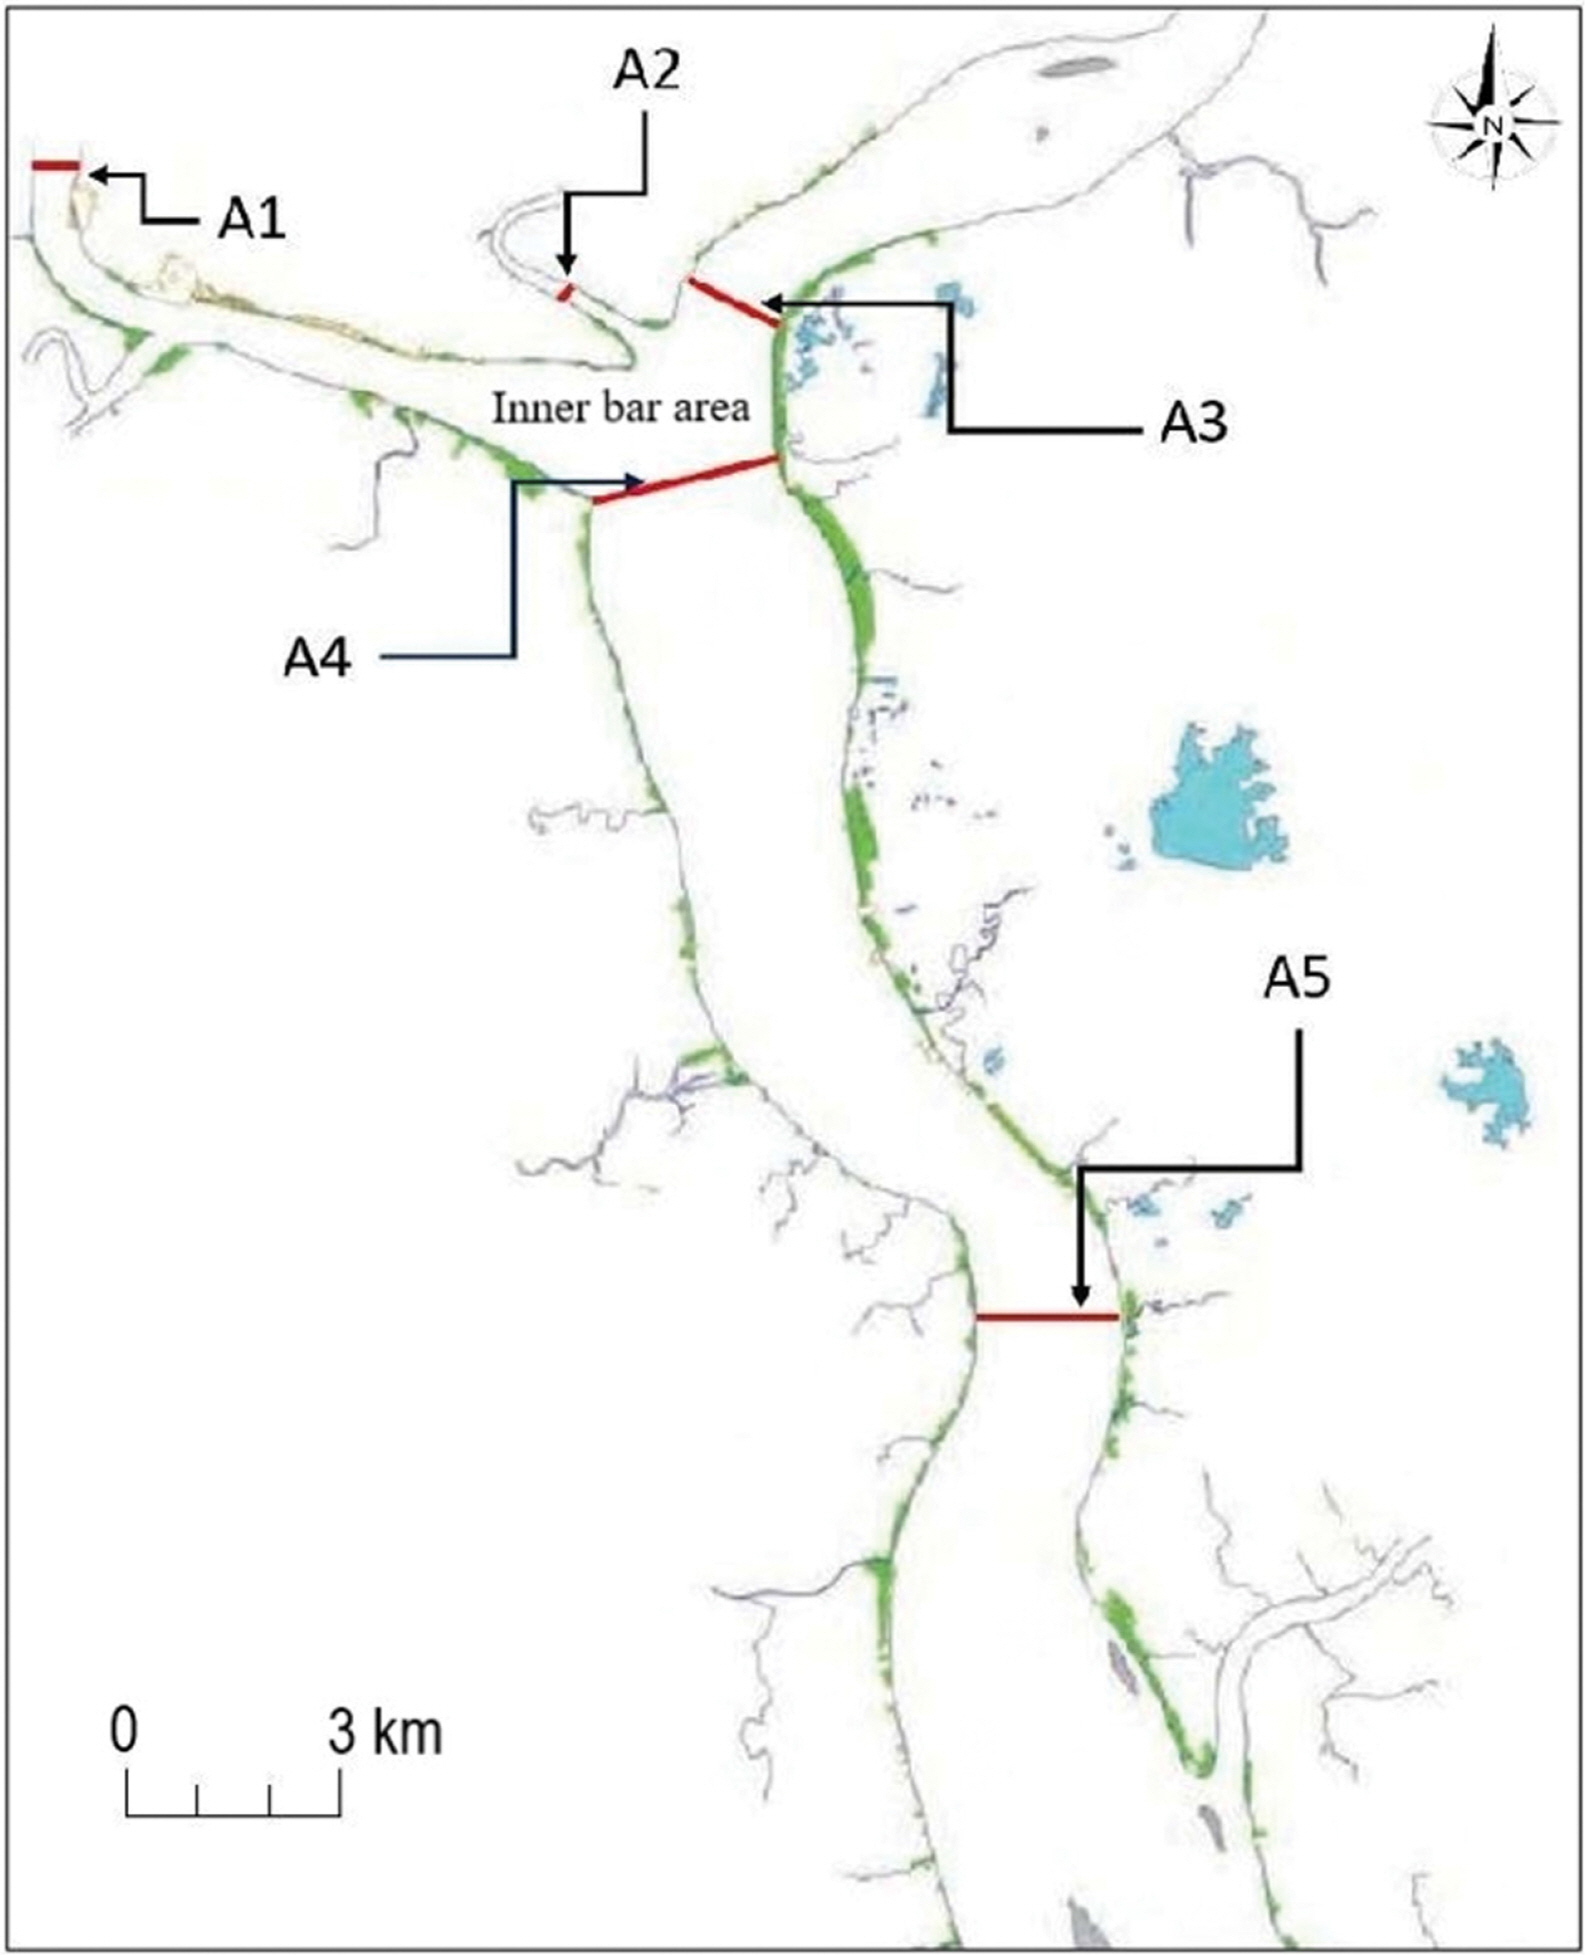
Fig. 3, illustrates the location of sediment grain sizes and river flow velocity survey areas in Yangon River, Bago River, Pazundaung Creek, and Inner bar area (near Monkey point). Sediment grain size data for all survey areas were measured on 21 August 2015. Sediments at a depth of about 10 cm under the surface of the bottom materials were taken three times by an Ekman Bottom Grab sampler, and blended to form a sample. Sampling dates, coordinate points, and the states of sediments (identification of deposit, sand, silt, etc., color, odor, etc.), were immediately observed and recorded. Then, grain-size analysis of sampled materials was conducted at the Lab to determine the representative grain size and gradation of each sample. For the river flow velocity observation at each cross section, the water depth was measured at the start and completion of the observation, and the flow velocity observation was conducted at 80% water depth with an electromagnetic current meter. The observation length for one time is at least 20 seconds and it was repeated at least 3 times, and then the average flow velocity and flow direction were confirmed. River flow velocity data for Pazundaung Creek (section A2) was only collected on the rainy season (June 2015), so average river depth and flow velocity data were assumed for dry season (October 2015) as Pazundaung creek is very small compared to the two rivers and its effect on the sediment transport in Yangon River is almost negligible. All measurement data were collected during low tide conditions to minimize tidal influence (JICA, 2016). The others required data for sediment transport calculation as river elevation data and width of river for each section was obtained from the ArcGIS map and the British Admiralty Nautical Chart 833 Yangon River (Rangoon River) and Approaches edited by Myanmar Navy at 2017.
4.2 Calculation methods
Bagnold (1966) formula for bed and suspended load was selected to calculate the sediment transport in Yangon River based on the applicable particle size and available collected data. In Bagnold (1966) theory stream power per unit of bed area of the flow, which is simply the product of shear stress along the bed and the average flow velocity, is regarded as the available power supply for transporting sediment particles (Habibi, 1994). According to Bagnold, a particle is suspended when the bed-shear velocity exceeds its fall velocity and that concept is used in Bagnold’s calculation of suspended load (Habibi, 1994). Bed material load is the main factor that causes the major changes of river geography and generally, it consists of all bed load and some parts of suspended load. Riverbed elevation changes due to the bed load sediment transport were only considered in this research based on the particle size and average flow velocities.
4.3 Calculation flows
Bed load sediment transport at each section A1, A2, A3, A4, and A5 were calculated in this research by using Bagnold (1966) formula. At first, bed shear stress of the channel was defined as
Where τo is the bed shear stress, γ is the unit weight of water, D is the flow depth and S is the channel slope. The unit weight of water in this calculation is used as 9800 N/m3, river flow depth was obtained from observation data as shown in Table 2 and 3, and channel slope was calculated as the change in elevation of riverbed divided by the ground distance. The elevation data of Yangon River, Pazundaung Creek, and Bago River were obtained from the Nautical Chart 833 Yangon River (Rangoon River) and Approaches (2017).
Shear velocity at the channel bed was calculated as
where u* is the shear velocity of the channel and the density of water ρ is 1000 kg/m3.
Where G is the G parameter, ρs is the density of sediment used as 2650 kg/m3, da is the arithmetic mean diameter of the sediment and ν is the kinematic viscosity of the flow used as 10-6 m2/s.
The coefficient of inter-angular friction, tanα, is found to be a function of shear velocity u* and bed material arithmetic mean diameter da (Habibi, 1994). Its value normally varies from 0.65 to 0.75 and can be calculated by using the following analytical equations.
Then, compute bed load transport efficiency eb as
(5)
where eb is the bed load transport efficiency and V is the average river flow velocity.
Bed load transport rate per unit width of flow qb can be calculated as
To calculate suspended sediment transport, fall velocity of the particle ω was calculated by the formula of Cheng (1997).
Where, dimensionless particle parameter d * = ( ∆ g ν 2 ) 1 / 3 d
Suspended load transport rate per unit width of flow qs was calculated as
qs and qb are the transport rate per unit width in kg/m/s and total bed load and suspended load transport rate can be calculated by multiplying with river width.
Where Qb and Qs are total bed load and suspended load transport rate in kg/s respectively and B is the width of the river.
5. Results
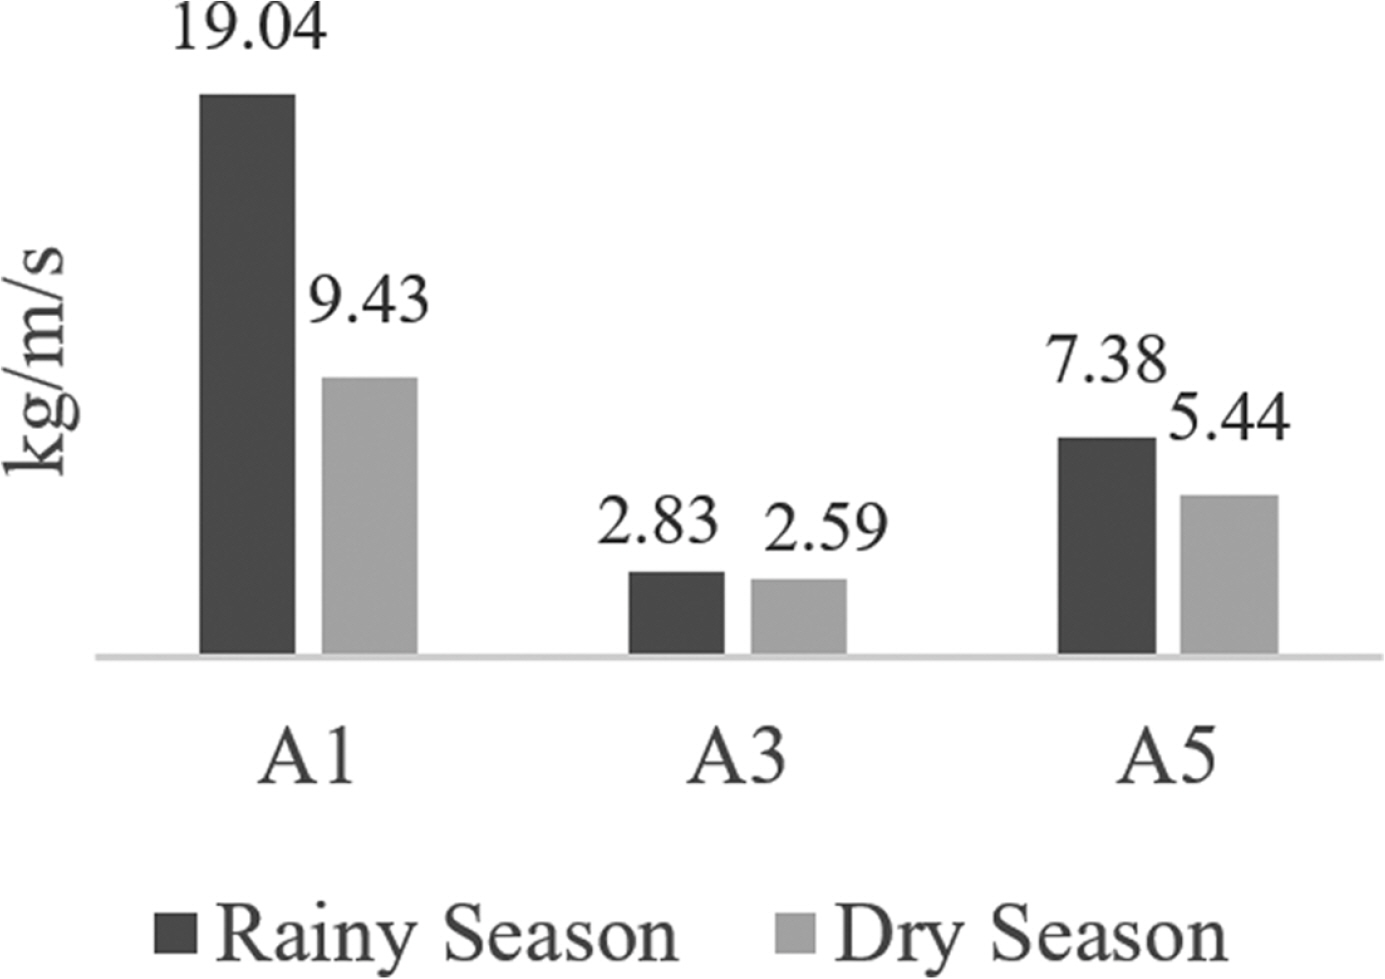
By using these calculation flows, bed load sediment transport at each section was computed for rainy season and dry season separately. But, riverbed elevation changes at inner bar area were predicted only for dry season due to the lack of flow velocity data in rainy season at section A4. The calculation results in Fig. 4. shows that the amount of bed load transport in rainy season is much higher than in dry season especially at the Upper Stream of Yangon Port, section A1. That result also indicates that most of the deposited sediment at inner bar area are from the Upper Stream of Yangon Port. According to the survey data, sediment grain size at section A1, A4, and A5 are almost similar. Therefore, this concept from the calculation result is also matched with observation data.
The amount of bed load material transported to inner bar area was obtained from the summation of total bed load transport at sections A1, A2, and A3. The difference between the amount of bed load transported to inner bar area and the amount of bed load transported from inner bar area were calculated as the amount of deposited sediment in that area. Base on this concept, the amount of deposited sediment at inner bar area was about 6,237,934 tons per year. As the density of sediment is 2.65 ton/m3, the volume of deposited sediment at inner bar area was about 2,353,937 m3 per year. So, 953,937 m3 of sediment were accumulated at inner bar area since MPA removed 1.4 million m3 of dredged materials from that area annually. The average area between the cross-sections is about 15.26 km2 and dividing the volume of deposited sediment with that area gave the rate of riverbed level rise at Monkey Point area as 0.063 m per year. The average rate of riverbed level rise can be also estimated by comparing the 1904 and 2015 Nautical Chart map, and that observation result of 0.036 m per year is not much difference with the calculation result by using Bagnold (1966) theory. So, for the same workload of maintenance dredging work, the riverbed level may rise to 3.15 m in next 50 years.
6. Discussions and Conclusions
One of the limitations of this research is the lack of longterm monitoring data for different river conditions such as flow velocities at different tidal conditions, different season and some extreme weather events. Due to the limitation of required observation data, the prediction of riverbed elevation changes is only based on the bed load sediment transport at dry season that cannot represent the actual annual sediment transport. But the output result indicates that Bagnold (1966) formula is suitable to calculate the sediment transport in Yangon River. The input data to this formula prediction can be easily changed for the new prediction when the new channel geometry or grain size data is available in the future. Comparison between direct measurement data of sediment transport and estimated results should be done in further research to get accurate results. Combination between the good sets of field observation data and numerical modeling also would be the best approach to solve the sedimentation problem in Yangon River.
Regardless of limited availability in the observation data, the calculated sediment transport generally agreed with the observation measured upstream and downstream of the inner bar area, which leads to a reasonable estimation and long-term prediction of the sedimentation rates in the inner bar. The good agreement with the observation data was, however, not obtained if other formulas were employed. According to the calculation result by using Engelund and Hansen (1967), and Yang (1973) formulas, the amount of deposited sediment at inner bar area was about 293 million m3 and 505 million m3 per year respectively. These results were too large compared to that calculated from the Bagnold formula though same concept of estimation method was applied. Because only 1.4 million m3 of sediment have to be removed from that area to maintain the channel, the transport formulae of Engelund and Hansen (1967), and Yang (1973) cannot be applied in Yangon River sedimentation problem due to the huge difference between an calculation results d real field data. The reason for their overestimation was likely because they provided total sediment transport load, not separating the bed load and suspended load. In Yangon River, the sediment grains are fine and thus most of suspended sediments are not contributing to the sedimentation process but washed downstream with the flows. Therefore, the better estimation by Bagnold formula supported the importance of bed load over suspended load in calculating the sedimentation rate in the inner bar area, and thus the bed load needed to be separated from the suspended load. The outcome of the estimated sedimentation rate indicates that riverbed level in the Monkey Point area may rise to 3.15 m in approximately 50 years, which requires urgent future studies for sustainable use of the Yangon Port and they may include more detailed investigations to understand the sedimentation process in this area using numerical models based on closer observation data.